


CONTENT TYPE
SUBJECT
- Number Sense (381)
- Number Recognition (30)
- Number Tracing (20)
-
Number Sequence
(56)
- Counting (141)
- Compare Numbers (47)
-
Compare Objects
(7)
-
Compare Numbers Using Place Value
(5)
-
Compare 2-Digit Numbers
(6)
-
Compare 3-Digit Numbers
(10)
-
Order Numbers
(15)
- Skip Counting (36)
-
Even And Odd Numbers
(3)
- Place Value (78)
- Round Numbers (16)
- Addition (369)
-
Add With Pictures
(38)
-
Addition Properties
(6)
- Addition Strategies (136)
- Compose And Decompose Numbers (66)
-
Count All To Add
(9)
-
Add Using A Number Line
(7)
-
Count On To Add
(11)
-
Add With 10
(2)
-
Doubles And Near Doubles Addition Strategy
(21)
-
Make 10 Strategy
(4)
-
Add Three Whole Numbers
(20)
- 2-Digit Addition (45)
- 3-Digit Addition (65)
- 4-Digit Addition (30)
- Large Numbers Addition (10)
- Subtraction (240)
-
Subtract With Pictures
(35)
- Subtraction Strategies (48)
- 2-Digit Subtraction (30)
- 3-Digit Subtraction (57)
- 4-Digit Subtraction (23)
- Large Numbers Subtraction (8)
- Multiplication (196)
- Multiplication Strategies (56)
-
Multiplication With Equal Groups
(16)
-
Multiplication With Arrays
(20)
-
Multiplication Sentences
(11)
-
Multiplication On A Number Line
(13)
-
Repeated Addition To Multiply
(17)
- Times Tables (88)
-
Multiplication By 2
(10)
-
Multiplication By 3
(10)
-
Multiplication By 4
(9)
-
Multiplication By 5
(10)
-
Multiplication By 6
(9)
-
Multiplication By 7
(8)
-
Multiplication By 8
(8)
-
Multiplication By 9
(9)
-
Multiplication By 10
(5)
-
Multiplication By 11
(5)
-
Multiplication By 12
(5)
- Multiplication Properties (15)
-
Multiply By Multiples Of 10
(8)
-
Estimate Products
(4)
- Multi-Digit Multiplication (40)
- Division (119)
-
Divide On A Number Line
(3)
- Division Facts (60)
-
Division By 2
(5)
-
Division By 3
(5)
-
Division By 4
(5)
-
Division By 5
(5)
-
Division By 6
(5)
-
Division By 7
(5)
-
Division By 8
(5)
-
Division By 9
(5)
-
Estimate Quotients
(4)
- Long Division (36)
- Fractions (186)
-
Fractions Using Models
(28)
-
Fractions On A Number Line
(10)
- Compare Fractions (22)
- Equivalent Fractions (25)
-
Mixed Numbers As Improper Fractions
(4)
- Fractions Operations (91)
- Decimals (138)
- Read And Write Decimals (40)
-
Compare Decimals
(22)
-
Order Decimals
(15)
- Round Decimals (12)
-
Convert Decimals To Fractions
(11)
- Decimal Operations (40)
- Geometry (129)
-
Positional Words
(5)
- Lines, Line Segments, Rays (6)
-
Angles
(15)
- Shapes (80)
- Partition Into Equal Parts (13)
-
Coordinate Plane
(7)
- Data Handling (46)
- Measurement (125)
- Length (34)
- Height (6)
-
Weight
(12)
-
Capacity
(12)
-
Conversion Of Measurement Units
(15)
-
Perimeter
(19)
-
Area
(18)
-
Volume
(8)
- Time (35)
-
Am And Pm
(2)
-
Time In Hours
(5)
-
Time In Half Hours
(4)
-
Time In Quarter Hours
(7)
-
Time To The Nearest 5 Minutes
(11)
-
Time To The Nearest Minute
(2)
-
Elapsed Time
(3)
- Money (60)
-
Identify Coins
(13)
-
Counting Money
(14)
-
Compare Money
(7)
-
Add And Subtract Money
(17)
-
Multiply And Divide Money
(7)
- Algebra (54)
-
Number Patterns
(29)
- Expressions And Equations (13)
-
Factors And Multiples
(7)
-
Prime And Composite Numbers
(5)
- Word Problems (97)
- Reading (2,269)
- Phonics (2,225)
- Bossy R (60)
-
Diphthongs
(22)
- Consonant Blends (118)
- Alphabet (262)
- Letter Recognition (262)
-
Letter A
(9)
-
Letter B
(9)
-
Letter C
(9)
-
Letter D
(9)
-
Letter E
(9)
-
Letter F
(9)
-
Letter G
(9)
-
Letter H
(9)
-
Letter I
(9)
-
Letter J
(9)
-
Letter K
(9)
-
Letter L
(9)
-
Letter M
(9)
-
Letter N
(9)
-
Letter O
(9)
-
Letter P
(9)
-
Letter Q
(9)
-
Letter R
(9)
-
Letter S
(9)
-
Letter T
(9)
-
Letter U
(9)
-
Letter V
(9)
-
Letter W
(9)
-
Letter X
(9)
-
Letter Y
(9)
-
Letter Z
(9)
-
Lowercase Letters
(78)
-
Uppercase Letters
(78)
-
Matching Lowercase And Uppercase Letters
(59)
- Alphabetical Order (54)
-
Letter Sounds
(130)
- Vowels (158)
- Long Vowel Sounds (75)
-
Long Vowel A Sound
(15)
-
Long Vowel E Sound
(17)
-
Long Vowel I Sound
(15)
-
Long Vowel O Sound
(15)
-
Long Vowel U Sound
(13)
-
Silent E
(12)
- Short Vowel Sounds (81)
-
Short Vowel A Sound
(59)
-
Short Vowel E Sound
(26)
-
Short Vowel I Sound
(59)
-
Short Vowel O Sound
(44)
-
Short Vowel U Sound
(24)
- Vowel Teams (65)
- Blending (432)
- Consonant Digraphs (8)
-
Double Consonants
(8)
-
Rhyming Words
(61)
-
Trigraphs
(38)
-
Three Letter Blends
(19)
- Sight Words (1,035)
- Reading Comprehension (44)
- Writing (124)
- Handwriting (124)
- Letter Tracing (124)
-
Letter Tracing A
(6)
-
Letter Tracing B
(6)
-
Letter Tracing C
(6)
-
Letter Tracing D
(6)
-
Letter Tracing E
(6)
-
Letter Tracing F
(6)
-
Letter Tracing G
(6)
-
Letter Tracing H
(6)
-
Letter Tracing I
(6)
-
Letter Tracing J
(6)
-
Letter Tracing K
(6)
-
Letter Tracing L
(6)
-
Letter Tracing M
(6)
-
Letter Tracing N
(6)
-
Letter Tracing O
(6)
-
Letter Tracing P
(6)
-
Letter Tracing Q
(6)
-
Letter Tracing R
(6)
-
Letter Tracing S
(6)
-
Letter Tracing T
(6)
-
Letter Tracing U
(6)
-
Letter Tracing V
(6)
-
Letter Tracing W
(6)
-
Letter Tracing X
(6)
-
Letter Tracing Y
(6)
-
Letter Tracing Z
(6)
- Food (60)
- Animals (58)
- Seasonal (28)
- Kitchen (11)
-
Musical Instruments
(30)
-
Birds
(20)
-
Space
(12)
- Transport (9)
-
Insects
(9)
-
Scene
(8)
-
Professions
(8)
-
Monuments
(8)
-
Household Items
(8)
-
Flowers
(8)
-
Buildings
(8)
-
Colors
(7)
-
Toys
(4)
- Coloring (181)
- Animals (32)
- Seasonal (28)
- Food (24)
- Transport (8)
-
Space
(8)
-
Scene
(8)
-
Professions
(8)
-
Musical Instruments
(8)
-
Monuments
(8)
- Kitchen (8)
-
Insects
(8)
-
Household Items
(8)
-
Flowers
(8)
-
Buildings
(8)
-
Birds
(8)
- Music (36)
-
Cooking
(7)
-
Stories
(10)
Number Sense Games
View all 381 games-
VIEW DETAILS
 Counting Backwards
Counting Back and Completing the Sequence Game
In this exciting math game, kids will practice counting back from 10 to complete sequences. They'll solve problems by selecting the correct answers from given options. This game helps develop counting and comparison skills, making math both fun and educational for young learners. Perfect for building confidence with numbers in a playful setting!
-
VIEW DETAILS
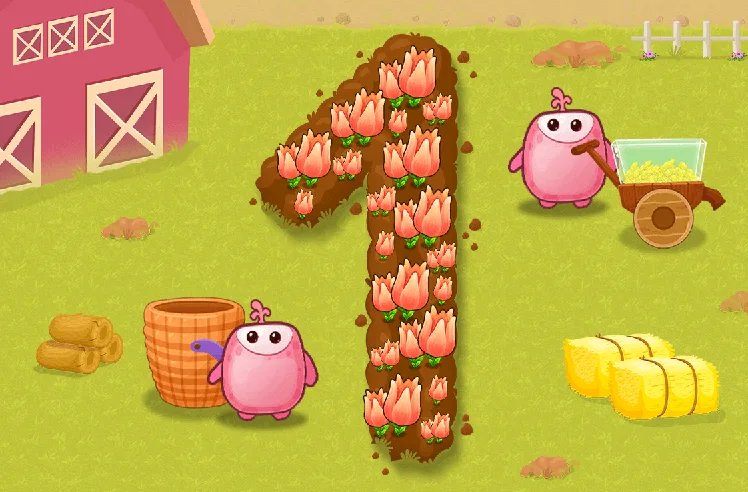 Number Tracing
Tracing the Number One Game
Welcome to Tracy farms, where kids will embark on a fun journey of tracing the number one. This engaging game combines math with nature as young learners trace numbers amidst flowers and fruits. Perfect for preschoolers, it builds early math skills while ensuring limitless fun. Kids will enjoy learning to write numbers up to 5. Get started with number tracing today!
-
VIEW DETAILS
 Number Sequence
Counting Sequence from 1 to 5 Game
Meet the Oolzoos in this exciting counting game! Kids will count up to 5 objects and explore number sequences with fun visuals. As they open presents, they'll practice counting in a horizontal arrangement and develop essential math skills. Perfect for preschoolers, this game makes learning numbers an engaging adventure. Get ready to count and play!
-
VIEW DETAILS
 Number Recognition
Counting Along with the Stars from 1 to 3 Game
In this magical game, kids will count stars from 1 to 3, helping Oolzoos make wishes come true. It's a fun way to learn number sequences and improve counting skills. As they connect stars, children actively engage with numbers, making the learning experience enjoyable and memorable. Join the adventure in the starry sky and complete the number sequence up to 5!
Addition Games
View all 369 games-
VIEW DETAILS
 Addition Strategies
Adding and Matching Game
In the Add and Match Game, kids tackle addition facts of 1 in a playful setting. This game clears up math misconceptions and boosts fluency in addition. Children will enjoy working with addition facts, enhancing their skills in a fun way. Perfect for young learners, it combines learning with excitement, making math a delightful adventure. Let's master addition facts of 1!
-
VIEW DETAILS
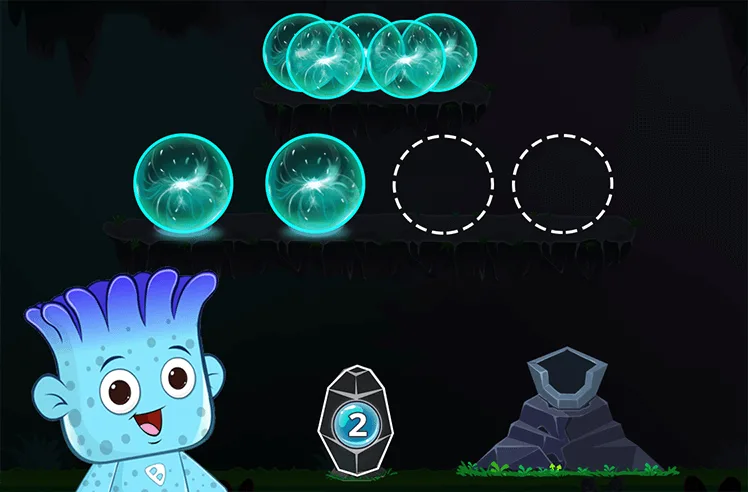 Add With Pictures
Modeling to Add Numbers Game
In this exciting math game, kids will model how to add numbers to illuminate a spooky cave. They'll engage with number orbs, boosting their understanding of addition and subtraction. As young mathematicians, they'll learn to build models for adding numbers, making math a thrilling adventure. Perfect for sparking interest in math concepts while having fun!
-
VIEW DETAILS
 Addition Properties
Identifying Turn Around Facts Game
In this colorful game, kids dive into the world of addition by exploring the commutative property. They'll practice identifying turn-around facts, making addition feel like a breeze. This engaging activity not only boosts their confidence in solving math problems but also strengthens their understanding of key addition and subtraction strategies. Get started now!
-
VIEW DETAILS
 Add Three Whole Numbers
Composing Numbers to Make 10 Game
Join Oolzoos and Blinky the Bat on a fun journey through the cave! Kids will learn to compose numbers to make 10, strengthening their addition and subtraction skills. This interactive game helps children fluently add within 10 while enjoying a playful adventure. Perfect for young math explorers eager to master essential math concepts. Start for free!
Subtraction Games
View all 240 games-
VIEW DETAILS
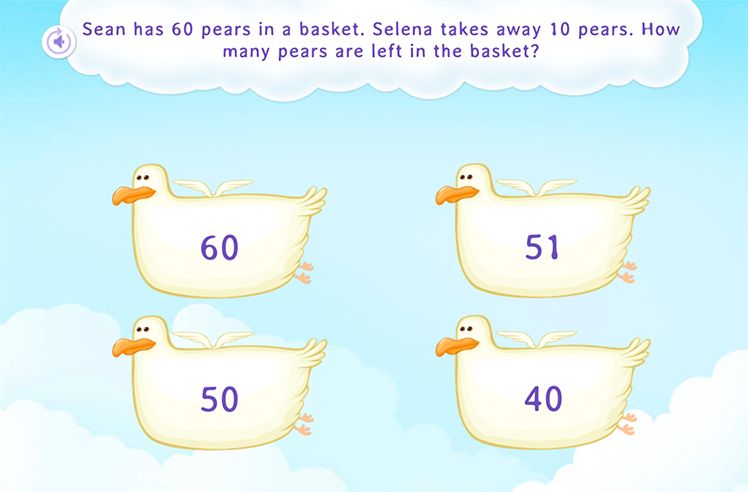 2-Digit Subtraction
Solve Word Problems on Taking From Scenarios Game
This exciting math game helps kids master subtraction by solving word problems in "take from" scenarios. They'll tackle subtraction challenges within 100, enhancing their problem-solving skills. Perfect for young learners, this game turns learning into an adventure, making math fun and interactive. Watch your child boost their confidence and math prowess!
-
VIEW DETAILS
 Subtract With Pictures
Removing and Matching the Number Game
Embark on a thrilling journey with Blu through dark caves, high mountains, and frozen lakes. This exciting game helps kids master subtraction by using pictures as visual aids. Children will learn to apply the count-out strategy, making math both fun and educational. Perfect for little rockstars ready to explore and learn! Join the adventure and boost subtraction skills effortlessly.
-
VIEW DETAILS
 3-Digit Subtraction
Solving Scenarios with ''Difference Unknown'' Game
In this math game, kids will dive into subtraction word problems where the "difference unknown" is key. They'll explore story situations and solve problems within 1000. This interactive game helps kids overcome common misconceptions and build confidence in subtraction. It's a fun way to practice and improve their skills in adding and subtracting within 1000.
-
VIEW DETAILS
 Subtraction Strategies
Subtracting and Matching Game
This fun game helps kids tackle subtraction facts, focusing on the number 1. Children solve a variety of problems, gaining confidence and fluency in subtraction. As they match and subtract, they'll clear up any misconceptions, making math enjoyable and easy. Perfect for young learners to build a solid foundation in math skills.
Multiplication Games
View all 196 games-
VIEW DETAILS
 Multiplication Strategies
Skip Counting to Find the Answer Game
Join the Skip Count to Find the Answer Game and explore the world of equal groups. Kids will tackle problems using skip counting to find missing numbers in patterns. This interactive game helps build a strong foundation for multiplication while enhancing place value and number sense skills. Perfect for young math adventurers eager to explore numbers within 20!
-
VIEW DETAILS
 Times Tables
Finding Facts of 2 Game
Are you ready to explore Sky Lands? This exciting game lets kids practice skip counting by 2 to uncover hidden paths. Perfect for young math enthusiasts, it focuses on multiplication facts of 2 and helps develop counting skills. Kids will enjoy solving problems with numbers up to 20 while enhancing their understanding of multiplication and division.
-
VIEW DETAILS
 Multiplication Properties
Multiplying Three Numbers Game
Explore the fun of multiplying three numbers with this engaging game! Kids will practice using the associative property, making multiplication a breeze. This interactive experience helps in mastering multiplication and division skills while building confidence in math. Perfect for young mathematicians ready to tackle new challenges!
-
VIEW DETAILS
 Multiply By Multiples Of 10
Multiplying and Answering in Unit Form Game
In this colorful game, kids will practice multiplying 1-digit numbers by multiples of 10. They'll apply multiplication and place value concepts to find products in unit form. The game offers a series of thoughtfully crafted problems to help kids become comfortable with advanced multiplication and division skills. It's a fun way to master math through practice!
Division Games
View all 119 games-
VIEW DETAILS
 Long Division
Finding the Quotient Game
Uncover the fun in division with this exciting game! Your child will tackle problems dividing 2-digit by 1-digit numbers, learning to find the quotient without remainders. This game is perfect for overcoming misconceptions in math and strengthening division skills. With each challenge, kids will enjoy a playful approach to mastering division concepts. Join the fun today!
-
VIEW DETAILS
 Estimate Quotients
Dividing Each Expression and Matching the Quotient Game
In this exciting game, kids will practice dividing 2-digit numbers by 1-digit numbers. They'll match each expression to its correct quotient, reinforcing their division skills. This engaging activity helps young mathematicians build confidence in solving division problems while having fun. Perfect for developing a strong understanding of division concepts!
-
VIEW DETAILS
 Divide On A Number Line
Representing Division on Number Line Game
In this engaging game, kids will visualize division using number lines. They'll solve division problems up to 100 by dragging and dropping items to the correct spots. This interactive activity helps children grasp division concepts while having fun. Perfect for young learners to practice and improve their multiplication and division skills. Start exploring division today!
-
VIEW DETAILS
 Division Facts
Completing the Division Expression for Equal Groups Game
In this engaging game, kids will tackle equal sharing problems using real-world objects. They'll drag and drop items to complete division expressions, working with numbers up to 20. This interactive activity helps build a strong foundation for division while making math fun and relatable. Perfect for young learners eager to master multiplication and division skills!
Fractions Games
View all 186 games-
VIEW DETAILS
 Compare Fractions
Comparing and Modeling Greater Fraction Game
In this exciting game, kids will create fraction models by shading parts to match given conditions. They'll learn to compare fractions with the same denominators using visuals, boosting their understanding of fractions. This interactive activity is perfect for making fraction learning fun and easy. Let your child explore the world of fractions today!
-
VIEW DETAILS
 Fractions Using Models
Partitioning into Equal Parts Game
Join the adventure to bring a city of stars and diamonds back to life! In this exciting game, kids will use fraction models to understand and represent fractions. They'll answer questions about equal parts, enhancing their math skills in a playful setting. It's a fun way to grasp fractions and enjoy learning. Ready for the challenge?
-
VIEW DETAILS
 Fractions On A Number Line
Identifying Missing Numerators on a Number Line Game
In this engaging math game, kids solve fraction problems using a number line. They'll identify and fill in missing numerators, gaining confidence in understanding fractions. Perfect for third graders, this game offers a variety of challenges to help them grasp the concept of fractions and improve their skills. Encourage learning and fun as they master fractions on number lines!
-
VIEW DETAILS
 Order Fractions
Comparing Unit Fractions without Visual Models Game
Explore the world of fractions with this interactive game! Kids will compare and order unit fractions without visual models, enhancing their understanding of fractions. By dragging and dropping, young mathematicians will skillfully place fractions in the correct order, making learning both fun and effective. This game is a great way to develop math skills in an engaging manner.
Decimals Games
View all 138 games-
VIEW DETAILS
 Order Decimals
Ordering Decimals with the Help of Place Value Chart Game
In this engaging math game, kids learn to order decimals less than 1 using a place value chart. With visual aids, fourth graders can confidently tackle problems on comparing and ordering decimals. This interactive experience builds essential math skills, making abstract concepts more accessible and fun.
-
VIEW DETAILS
 Compare Decimals
Comparing Decimals Using Place Value Chart Game
This exciting game helps kids master comparing decimals using a place value chart. Fourth graders will select correct answers from options to solve problems, gaining confidence in comparing decimals less than 1. With visual aids, students can easily grasp the concept and improve their math skills. Perfect for young math enthusiasts eager to learn!
-
VIEW DETAILS
 Round Decimals
Rounding Tenths Using a Number Line Game
Help your child master decimals with this engaging game! They'll learn to round tenths to the nearest whole number using a number line. This game offers effective practice, turning a tricky concept into a fun challenge. With focused exercises, kids enhance their understanding of decimals and build confidence in rounding numbers. Play and learn today!
-
VIEW DETAILS
 Read And Write Decimals
Identifying Decimal Numbers Using Fraction Models Game
Uncover the world of decimals as your child learns to identify decimal numbers using fraction models. Through engaging tasks, kids explore decimal notation for tenths with easy-to-understand visual aids. This game is perfect for fourth graders to gain confidence in math and understand decimals better. Watch them master decimals in a fun and interactive way!
Geometry Games
View all 129 games-
VIEW DETAILS
 Shapes
Sorting Real-World Shapes Game
In this fun shape sorting game, kids will drag and drop objects to match their shape names. Perfect for budding mathematicians, it helps them understand geometric shapes using real-world examples. Watch your child enhance their sorting skills while having a blast with this interactive activity. It's a playful way to boost their knowledge of shapes!
-
VIEW DETAILS
 Positional Words
Identifying Objects Above and Below Game
In this engaging math game, kids will learn to identify objects using positional words like above and below. By solving visual puzzles, they'll strengthen geometry skills and enhance their understanding of object positions. This interactive game is designed to make learning fun and help young minds develop essential math concepts with ease. Get started today!
-
VIEW DETAILS
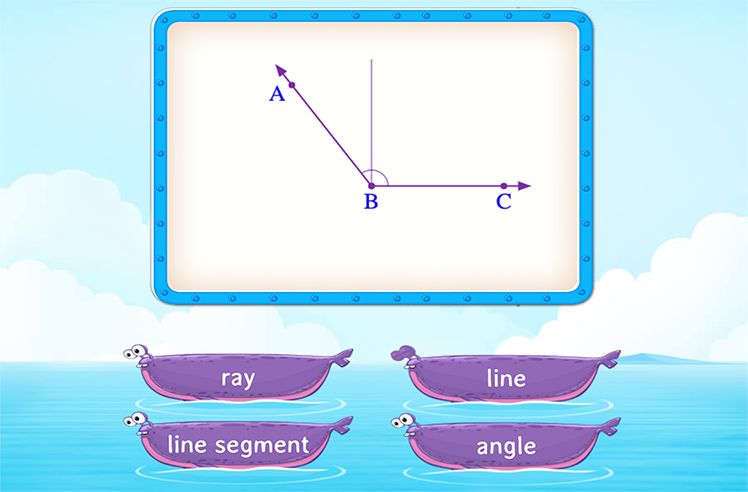 Lines, Line Segments, Rays
Recognizing Lines, Line Segments, Rays, Angles Game
This engaging geometry game helps kids recognize lines, line segments, rays, and angles. Through interactive challenges, students will apply their math knowledge to identify and classify shapes based on angles and lines. Perfect for fourth graders, this game offers plenty of opportunities to tackle misconceptions and enjoy learning geometry in a fun way.
-
VIEW DETAILS
 Angles
Finding Right Angles Game
In this engaging game, kids will explore two-dimensional shapes and learn to identify right angles. By analyzing and choosing the correct options, they'll master geometry skills in a fun way. Perfect for third graders, this game builds confidence in understanding shapes and their attributes. Let your child become a geometry expert while having fun!
Data Handling Games
View all 46 games-
VIEW DETAILS
 Sorting Objects
Identifying Objects by Color Game
Unleash your child's color recognition skills with this exciting game. They'll sort and classify objects by color, mastering data handling in a playful way. Designed for young learners, this game offers smart tasks to make learning enjoyable and effective. Watch as your child becomes a pro at sorting and counting objects. Get started now!
-
VIEW DETAILS
 Bar Graphs
Read and Interpreting Data Using Bar Graphs Game
Unlock the world of data with our exciting bar graphs game! Kids will read and interpret data, turning math into a fun adventure. They'll enhance their data handling skills, making learning enjoyable and interactive. Perfect for young learners, this game is a great way to practice measurement and data skills while having a blast. Get started today!
-
VIEW DETAILS
 Line Plots
Read and Interpreting Data Using Line Plots Game
Engage your child in a fun math adventure with this game focused on reading and interpreting data using line plots. Kids will learn to extract information and answer questions, making data handling easier and more enjoyable. With each level, they'll become more confident in their measurement and data skills. Perfect for young learners to practice and grow!
-
VIEW DETAILS
 Picture Graphs
Completing Picture Graphs Game
In this exciting math game, kids will explore the world of picture graphs by reading and analyzing data. They'll practice creating graphs using provided data, enhancing their understanding of measurement and data handling. It's a fun way to grasp essential skills in reading, analyzing, and representing data. Perfect for young learners eager to dive into data adventures!
Measurement Games
View all 125 games-
VIEW DETAILS
 Height
Identifying the Object with Shorter Height Game
Explore the world of heights with this engaging game! Kids will learn to compare objects by identifying the shorter ones, enhancing their measurement skills. This interactive adventure makes learning fun and helps young minds grasp essential math concepts effortlessly. Perfect for budding mathematicians eager to explore the world of measurements!
-
VIEW DETAILS
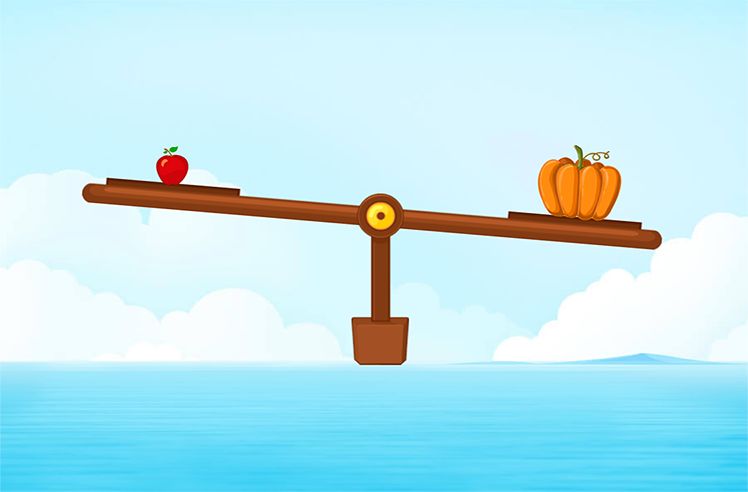 Weight
Identifying the Heavier Object Game
In this fun math game, kids will learn to compare weights using a balance scale. By identifying the heavier object, they'll practice key measurement skills. The game offers a series of exciting tasks that make learning about weights enjoyable and interactive. Perfect for young learners, this game helps kids gain confidence in understanding measurement concepts.
-
VIEW DETAILS
 Length
Identifying the Object with Shorter Length Game
In this exciting game, kids will learn to compare lengths using terms like longer, shorter, and equal. By practicing measurement concepts, children become more comfortable with identifying objects of different sizes. This fun and interactive game boosts their understanding of measurement and data while keeping them engaged and entertained.
-
VIEW DETAILS
 Capacity
Guessing the Correct Unit of Capacity Game
In this engaging game, kids will guess the correct units of capacity by using everyday objects as visual guides. Perfect for young learners, this game makes mastering measurement fun and interactive. By solving real-world problems, children will improve their understanding of metric units and enhance their measurement skills. Get ready to learn and have fun!
Time Games
View all 35 games-
VIEW DETAILS
 Time In Half Hours
Reading Time in Half Hours Game
Introduce your child to the world of time-telling with this engaging game. They'll learn to read and tell time in half hours using analog clocks, building essential math skills. Perfect for young learners, this game offers timely practice that makes understanding time fun and easy. Watch as your child gains confidence and accuracy in reading clocks!
-
VIEW DETAILS
 Am And Pm
Relating Activities with A.M. and P.M. Game
This interactive game makes learning about a.m. and p.m. a breeze! Kids will solve fun problems to guess the time, helping them understand the difference between morning and afternoon activities. Perfect for young learners, this game enhances their ability to read clocks and tell time, all while having an exciting play experience. Get started now!
-
VIEW DETAILS
 Time In Quarter Hours
Identifying Quarter Past and Quarter To Game
In this exciting math game, kids will learn to tell time by identifying quarter past and quarter to. They'll analyze options and pick the right one, making time-telling fun and interactive. This game helps develop essential skills in reading clocks and understanding time, perfect for young learners eager to explore the world of time. Join the fun today!
-
VIEW DETAILS
 Time In Hours
The Hour Hand Game
This exciting game helps kids master time-telling by focusing on the hour hand. Using an analog clock, children answer questions that clear up common misconceptions about time. It's a fun way to practice reading clocks and telling time, while building essential skills in time and money. Perfect for young learners eager to understand the concept of time!
Money Games
View all 60 games-
VIEW DETAILS
 Add And Subtract Money
Adding the Given Amounts of Money Game
In this exciting math game, kids will practice adding money by solving engaging problems. They'll analyze options and pick the right totals, boosting their skills in handling money. With plenty of opportunities to learn, children will become more confident in computing change and understanding money symbols. A fun way to make math relatable and enjoyable!
-
VIEW DETAILS
 Identify Coins
Different Types of Coins Game
Let your child dive into the exciting world of coins! This game helps them recognize and identify different coins like pennies, nickels, and dimes. Your young mathematician will practice counting money and develop a keen sense of currency. It's a fun way to build confidence and understanding in handling money. Join the adventure and watch them master time and money skills!
-
VIEW DETAILS
 Counting Money
Counting Money with Coins of a Type Game
In this exciting math game, kids will learn to count money using coins of a specific type. They'll practice identifying pennies, nickels, and dimes and calculating their total value. By analyzing and selecting the correct answers, young learners will boost their counting skills and gain a better understanding of money concepts. Perfect for budding mathematicians!
-
VIEW DETAILS
 Compare Money
Ordering Coins by Their Values Game
In this exciting math game, kids will learn to identify and order coins by their value. They'll work with pennies, nickels, and dimes, gaining confidence and skills in recognizing and counting money. Perfect for young learners, this game makes understanding money fun and interactive. Let your child explore and enjoy while mastering essential money concepts!
Algebra Games
View all 54 games-
VIEW DETAILS
 Number Patterns
Completing the Pattern of Tens Game
Challenge your child's math skills with this exciting game focused on number patterns. Kids will solve problems using skip counting, learning to add and subtract within 100. They'll apply prior knowledge to complete sequences and overcome misconceptions in math. It's a fun way to understand 10 more or 10 less than a number. Start for free!
-
VIEW DETAILS
 Expressions And Equations
Understanding the Equal Sign Game
In this engaging math game, kids will explore the meaning of the equal sign through fun addition and subtraction challenges. They'll answer questions using their understanding of equality, boosting their math skills. Perfect for young learners, this game makes learning math concepts enjoyable and interactive. Join the fun and watch your child's confidence grow!
-
VIEW DETAILS
 Factors And Multiples
Filling in the Missing Multiples Game
Your child will dive into the world of numbers with this engaging game. They'll practice finding multiples of numbers within 100, filling in the missing ones to boost their math skills. This game simplifies the concept of multiples, making it less confusing and more fun. It's a perfect way to explore factors, multiples, and prime numbers in an exciting way!
-
VIEW DETAILS
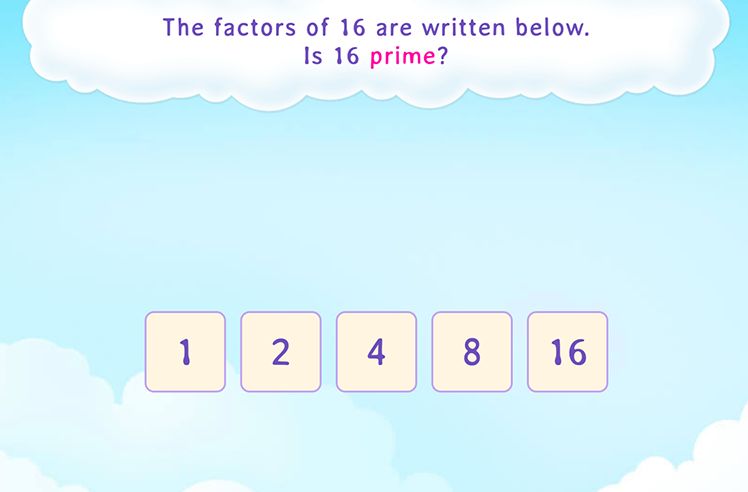 Prime And Composite Numbers
Choosing the Prime Number Out of the Given Numbers Game
This exciting math game helps kids identify prime numbers from a set of given numbers. Perfect for practicing algebra, it clears up common misconceptions about prime numbers. Players will explore factors, multiples, and prime numbers, boosting their math skills while having a blast. Ideal for young mathematicians eager to dive into algebra!
Word Problems Games
View all 97 games-
VIEW DETAILS
 Multiplication Word Problems
Solving the Word Problems Related to Multiplication Game
Tackle multiplication word problems with this engaging game! Kids will strengthen their problem-solving skills by working on multiplicative comparison scenarios. They'll solve for unknown quantities while having fun. This game makes understanding multiplication easy and enjoyable, helping kids build confidence in math.
-
VIEW DETAILS
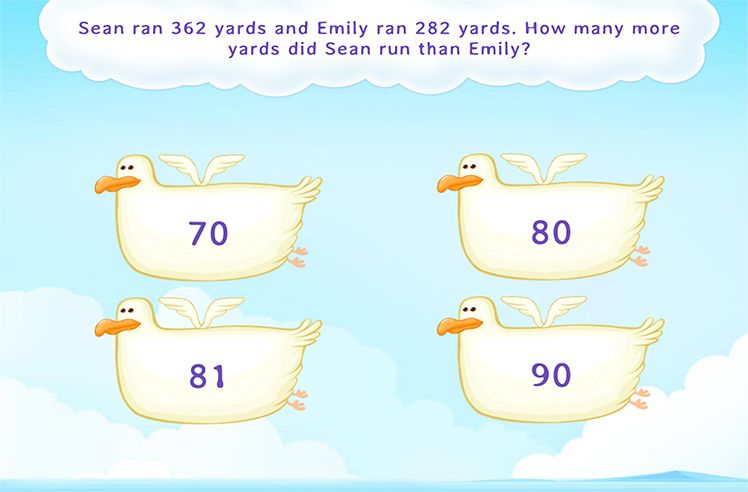
 Subtraction Word Problems
Solving Subtraction Scenarios Game
In this exciting game, kids will dive into the world of subtraction by solving real-life scenarios. They'll use visual aids to understand "take away" concepts and apply subtraction in everyday situations. Perfect for young learners, this game makes math fun and interactive, helping children build essential addition and subtraction skills. Get ready for an educational adventure!
-
VIEW DETAILS
 Division Word Problems
Word Problems on How Many Tens Game
This engaging game helps first graders solve word problems by identifying how many tens are in numbers. Kids will apply place value concepts to real-life scenarios, enhancing their number sense. The game offers a fun and interactive way to practice math skills, nudging your child towards mastery in place value and understanding multiples of 10. Get started now!
-
VIEW DETAILS
 Addition Word Problems
Adding One by Making a Model Game
In this engaging math game, kids will solve addition problems using a 10-frame model. They'll tackle word problems and practice "put together" scenarios, enhancing their problem-solving skills. Perfect for young mathematicians, this game makes learning addition fun and interactive. Students will enjoy boosting their math skills with each challenge!
Reading Games
View all 2,269 games-
VIEW DETAILS
 Phonics
Can You Find the Uppercase Letter A? Game
In this exciting game, kids will search for the uppercase letter A, helping them develop essential letter identification skills. As they play, they'll become familiar with uppercase letters A-Z, building a strong foundation for reading. It's a fun and interactive way to learn, making the journey to fluent reading enjoyable and effective. Let's get started!
-
VIEW DETAILS
 Reading Comprehension
What's the Cause? - Part 3 Game
In this exciting game, kids will strengthen their reading skills by identifying cause and effect relationships in texts. By critically analyzing events, children will enhance their logical thinking. This game offers a fun and enriching experience, helping young readers improve comprehension while having a great time. Get started on this learning adventure today!
-
VIEW DETAILS
 Reading Comprehension
What's the Effect? - Part 3 Game
In this fun game, kids explore cause and effect by identifying the effects of various events. Perfect for enhancing reading and critical thinking skills, it allows children to understand why certain results occur. Dive into interactive scenarios and watch your child learn to connect actions with outcomes, making reading comprehension a breeze.
-
VIEW DETAILS
 Phonics
Matching Big and Small A Game
In this exciting game, kids will match uppercase and lowercase "a" to boost their ELA skills. Perfect for preschoolers, this interactive activity makes learning letters A-Z fun and engaging. Watch your child enjoy discovering the alphabet while building a strong foundation in reading. Play now and start the adventure of matching letters with ease!
Writing Games
View all 124 games-
VIEW DETAILS
 Handwriting
Let's Make the Letter A Game
In this fun game, kids will learn to write the letter A by understanding the use of slanting and sleeping lines. Perfect for preschoolers, it introduces letter formation and sounds in an exciting way. Encourage your child to explore the alphabet with interactive play and develop essential writing skills. Begin the adventure of mastering the letter A today!
-
VIEW DETAILS
 Handwriting
Time to Trace Uppercase A Game
In this exciting game, your child will learn to trace the uppercase A, building essential writing skills and letter recognition. Perfect for preschoolers, this activity makes learning letters fun and interactive. Watch as your child gains confidence in tracing and identifying letters, setting a strong foundation for future reading and writing. Let's get going!
-
VIEW DETAILS
 Handwriting
Tracing Big Letters with Sleeping & Slanting Lines - A, V, W, X, Y, & Z Game
Introduce your preschooler to the world of uppercase letters with this engaging tracing game. Using sleeping and slanting lines, kids will trace letters A, V, W, X, Y, and Z, building foundational writing skills. This fun activity helps your child recognize and form big letters, setting the stage for future writing success. Get ready for some tracing fun!
-
VIEW DETAILS
 Handwriting
Time to Trace Lowercase a Game
Get ready to trace the lowercase "a" with this engaging game! Perfect for preschoolers, it helps kids develop writing skills and recognize letters. Kids will have fun tracing and mastering the letter "a" while building a strong foundation in letter identification. Let's make learning enjoyable and interactive. Time to get going!
Food Games
View all 60 games-
VIEW DETAILS
 Dessert
Cookie: Chef Yum Yum
Step into the kitchen and bake mouthwatering cookies.
-
VIEW DETAILS
 Dairy
DairyCheese-Themed Coloring Fun
Paint delicious blocks of cheese with vibrant colors.
-
VIEW DETAILS
 Vegetables
Vibrant Bell Pepper Coloring Adventure
Explore the world of fruits and vegetables and paint colorful bell peppers in this interactive coloring game.
-
VIEW DETAILS
 Fruits
Banana: Tropical Coloring Adventure
Dive into a fruity adventure and paint vibrant bananas.
Animals Games
View all 58 games-
VIEW DETAILS
 Reptiles
Iguana: Picture Perfect
Dive into the world of reptiles and paint picture-perfect iguanas in this engaging game.
-
VIEW DETAILS
 Underwater
Dive into Clownfish Coloring
Dive into an underwater adventure and paint vibrant clownfish swimming amidst coral reefs in this game.
-
VIEW DETAILS
 Underwater
Dive into the Turtle Picture
Embrace your artistic side and create a beautiful picture of an adorable turtle in this engaging game.
-
VIEW DETAILS
 Dinosaurs
Allosaurus: Dinosaur Coloring Adventure
Travel back in time and paint fierce allosaurs with vibrant colors.
Seasonal Games
View all 28 games-
VIEW DETAILS
 Halloween
Bat Coloring Adventure
Paint enchanting bats with a burst of colors in this coloring adventure game.
-
VIEW DETAILS
 Christmas
Ringing Bells Coloring Adventure
Jingle all the way with colorful bells in this exciting coloring adventure game.
-
VIEW DETAILS
 Christmas
Christmas Pudding Coloring Magic
Celebrate the holidays with a burst of colors in this coloring adventure game.
-
VIEW DETAILS
 Halloween
Mysterious Black Cat Coloring Adventure
Bring mischievous black cats to life with vibrant colors.
Kitchen Games
View all 11 games-
VIEW DETAILS
 Utensils
Kitchenware Coloring: The Fork
Explore the beauty of everyday objects and paint detailed illustrations of forks in this coloring adventure game.
-
VIEW DETAILS
 Cookie Cutter
Donut: Chef Yum Yum
Step into the kitchen and create mouthwatering donuts.
-
VIEW DETAILS
 Utensils
Knife Coloring Adventure
Discover the art of illustration and paint detailed depictions of knives in this engaging coloring adventure game.
-
VIEW DETAILS
 Utensils
Shiny Glass Coloring Adventure
Unleash your creativity and paint intricate glass objects in this immersive coloring adventure game.
Musical Instruments Games
View all 30 games-
VIEW DETAILS
 Musical Instruments
Drum Beat Coloring Fun
Let your creativity beat to the rhythm and paint vibrant drums.
-
VIEW DETAILS
 Musical Instruments
Groovy Guitar Coloring Adventure
Strum your artistic skills and paint rocking guitars in this coloring adventure game.
-
VIEW DETAILS
 Musical Instruments
Maracas Shake Up Your Coloring Skills
Paint vibrant maracas and bring the rhythm to life in this coloring adventure game.
-
VIEW DETAILS
 Musical Instruments
Musical Flute Coloring Fun
Paint melodious flutes with a burst of colors in this coloring adventure game.
Birds Games
View all 20 games-
VIEW DETAILS
 Birds
BirdsExplore Beauty with Colorful Geese
Explore the beauty of nature with colorful geese in this picture perfect game.
-
VIEW DETAILS
 Birds
BirdsChicken: Picture Perfect
Paint charming chickens in this picture perfect game.
-
VIEW DETAILS
 Birds
BirdsEagle: Picture Perfect
Spread your wings and paint majestic eagles in this picture perfect game.
-
VIEW DETAILS
 Birds
BirdsDive into Colors with Ducks
Dive into a pond of colors with ducks in this picture perfect game.
Space Games
View all 12 games-
VIEW DETAILS
 UFO
UFOBalloon Pop - Unknown Flying Object:UFO: Toss Up
Test your tossing skills and pop balloons to reveal unidentified flying objects (UFOs) in this exciting game.
-
VIEW DETAILS
 UFO
UFOSpace Hunt: Peek A Boo
Embark on a space-themed adventure and search for hidden objects in this interactive game.
Transport Games
View all 9 games-
VIEW DETAILS
 Vehicles
Airplane: Sky-high Coloring Adventure
Embark on an artistic journey and paint dynamic airplanes taking flight in this coloring adventure game.
-
VIEW DETAILS
 Vehicles
Helicopter Coloring: Sky High Fun
Let your creativity take flight as you paint vibrant illustrations of helicopters in this engaging coloring game.
-
VIEW DETAILS
 Offroad
Master Garage Management
Become a master of organization and park cars in this garage management game.
Insects Games
View all 9 games-
VIEW DETAILS
 Insects
Beautiful Butterfly Coloring Adventure
Let your creativity take flight and paint breathtaking butterflies.
-
VIEW DETAILS
 Insects
Buzzing Bee Coloring Adventure
Buzz with creativity and paint adorable bees with a palette of colors.
-
VIEW DETAILS
 Insects
Beetle Coloring Adventure
Embark on a colorful journey and paint fascinating beetles.
-
VIEW DETAILS
 Insects
Caterpillar Coloring Adventure
Paint cute caterpillars with a burst of colors in this coloring adventure game.
Scene Games
View all 8 games-
VIEW DETAILS
 Scene
SceneJungle: Wild Coloring Adventures
Immerse yourself in the wild and paint a lush jungle scene teeming with life in this coloring adventure game.
-
VIEW DETAILS
 Scene
SceneAutumn Fall: Seasonal Coloring Adventure
Paint a picturesque autumn scene and immerse yourself in the beauty of fall in this coloring adventure game.
-
VIEW DETAILS
 Scene
SceneBeach Scene Coloring Adventure
Dive into a tropical paradise and paint a vibrant beach scene in this coloring adventure game.
-
VIEW DETAILS
 Scene
SceneExciting Circus Coloring Experience
Unleash your creativity and paint a vibrant circus scene filled with excitement and joy in this coloring adventure game.
Professions Games
View all 8 games-
VIEW DETAILS
 Professions
Chef's Coloring Journey
Unleash your inner artist and paint a vibrant chef in this coloring adventure game.
-
VIEW DETAILS
 Professions
Doctor's Coloring Journey
Use your artistic skills to paint a compassionate doctor in this coloring adventure game.
-
VIEW DETAILS
 Professions
Astronaut: Space Coloring Adventure
Embark on a cosmic coloring adventure and paint a vibrant astronaut in this game.
-
VIEW DETAILS
 Professions
Farmer's Coloring Journey
Dive into the agricultural world and paint a cheerful farmer in this coloring adventure game.
Monuments Games
View all 8 games-
VIEW DETAILS
 Monuments
Experience Colosseum Coloring
Travel back in time and color the magnificent Colosseum with vibrant hues.
-
VIEW DETAILS
 Monuments
London Bridge Coloring Adventure
Create a picturesque scene by coloring the iconic London Bridge.
-
VIEW DETAILS
 Monuments
Liberty Bell Coloring Adventure
Paint the symbol of freedom, the Liberty Bell, with a burst of colors.
-
VIEW DETAILS
 Monuments
Eiffel Tower Coloring Experience
Embark on a Parisian coloring adventure and paint the iconic Eiffel Tower.
Household Items Games
View all 8 games-
VIEW DETAILS
 Household Items
Balloon: Sky-high Coloring Adventure
Let your creativity soar and paint vibrant balloons in this coloring adventure game.
-
VIEW DETAILS
 Household Items
Chair Coloring Adventure
Express your artistic touch and paint stylish chairs in this coloring adventure game.
-
VIEW DETAILS
 Household Items
Book Coloring Adventure
Dive into a world of imagination and color books with vibrant hues.
-
VIEW DETAILS
 Household Items
Ball: Bouncy Coloring Adventure
Paint bouncy balls with a burst of colors and bring them to life.
Flowers Games
View all 8 games-
VIEW DETAILS
 Flowers
Delightful Daisy Coloring
Paint vibrant daisies and bring the beauty of flowers to life.
-
VIEW DETAILS
 Flowers
Lotus An Exciting Coloring Adventure
Paint serene lotus flowers and create a tranquil atmosphere.
-
VIEW DETAILS
 Flowers
Jasmine: Fragrant Coloring Fun
Explore the world of jasmine flowers with a burst of colors.
-
VIEW DETAILS
 Flowers
Lily Coloring Adventure
Dive into a world of elegance and color lilies with vibrant hues.
Buildings Games
View all 8 games-
VIEW DETAILS
 Buildings
Church-Themed Coloring Fun
Paint a beautiful church with a rainbow of colors in this coloring adventure game.
-
VIEW DETAILS
 Buildings
Exciting Bank Coloring Adventure
Color a bustling bank scene with vibrant colors in this coloring adventure game.
-
VIEW DETAILS
 Buildings
Creative Barber Shop Coloring Adventure
Bring the barber shop to life with colorful hues in this coloring adventure game.
-
VIEW DETAILS
 Buildings
Bakery: Delicious Coloring
Step into a sweet world and color delicious treats in this coloring adventure game.
Colors Games
View all 7 games-
VIEW DETAILS
 Colors
Spot Hidden Orange Shapes
Train your eyes and spot hidden orange shapes in this challenging game.
-
VIEW DETAILS
 Colors
Pink: Sneaky Shapes
Exercise your perception and discover hidden pink shapes in this captivating game.
-
VIEW DETAILS
 Colors
Blue: Sneaky Shapes
Sharpen your observation skills and spot hidden blue shapes in this engaging game.
-
VIEW DETAILS
 Colors
Uncover Hidden Green Shapes
Test your visual acuity and uncover hidden green shapes in this thrilling game.
Coloring Games
View all 181 games-
VIEW DETAILS
 Seasonal
4th of July: Creative Coloring Adventure
Paint a festive scene filled with red, white, and blue to commemorate the 4th of July in this coloring adventure game.
-
VIEW DETAILS
 Transport
Hot Air Balloon Coloring Adventures: A Sky High Colorfest
Experience the joy of floating in the sky and paint delightful hot air balloons in this coloring adventure game.
-
VIEW DETAILS
 Animals
Ape: Jungle Coloring Adventure
Embark on a coloring adventure with playful apes.
-
VIEW DETAILS
 Food
FoodCupcake Coloring Fun
Decorate delightful cupcakes with a splash of colors.
Music Games
View all 36 games-
VIEW DETAILS
 Poems
PoemsEnjoy the All of Me Juke Box
Show off your singing skills and perform the popular song "All of Me" in this interactive game.
-
VIEW DETAILS
 Rhymes
Play Baba Black Sheep Band Jam
Join the band and play the popular song "Baba Baba Black Sheep" in this interactive game.
-
VIEW DETAILS
 Poems
PoemsExperience Down They Go Juke Box
Sing along and perform the catchy song "Down They Go" in this interactive game.
-
VIEW DETAILS
 Rhymes
Dive into Mulberry Bush Band Jam
Join the band and play the classic song "Here We Go Round The Mulberry Bush" in this interactive game.
Cooking Games
View all 7 games-
VIEW DETAILS
 Blend
BlendIce Cream: Chef Yum Yum
Scoop up the fun and make mouthwatering ice cream creations.
-
VIEW DETAILS
 Baking
Cupcake: Chef Yum Yum
Let your creativity shine and decorate delightful cupcakes.
-
VIEW DETAILS
 Slicing
Pizza: Chef Yum Yum
Become a master pizza chef and create delicious pizzas.
Stories Games
View all 10 games-
VIEW DETAILS
 Stories
Dive into Busy Body Sleep Solution Juke Box
Listen to calming tunes and relax your body for a peaceful sleep in this interactive game.
-
VIEW DETAILS
 Stories
Enjoy Dream Vacation Juke Box
Take a musical journey to your dream vacation destination in this immersive game.
-
VIEW DETAILS
 Stories
Explore Little Turtle's Dream Juke Box
Join Little Turtle on a musical adventure and explore his dream world in this interactive game.
-
VIEW DETAILS
 Stories
Enjoy Going Batty Juke Box
Sing and groove to the catchy tune of "Going Batty" in this interactive jukebox game.
Puzzles Games
View all 11 games-
VIEW DETAILS
 Block Puzzle
Challenge Two of a Kind
Sharpen your memory and find matching pairs in this engaging game.
-
VIEW DETAILS
 Scrabble
Play Word Detective
Put your word skills to the test and solve puzzles like a detective.
-
VIEW DETAILS
 Tile Puzzle
Picture Perfect
Paint, draw, and express your artistic skills in this picture perfect game.
-
VIEW DETAILS
 Matching
Sneaky Shapes
Sharpen your observation skills and uncover hidden shapes.
Time Based Games
View all 12 games-
VIEW DETAILS
 Time Based
Dive into Sky Boxes
Test your stacking skills and reach new heights in this sky-high game.
-
VIEW DETAILS
 Time Based
Speedy Snails
Join the speedy snails in a thrilling race for victory.
-
VIEW DETAILS
 Time Based
Number Ninja: Fun Math Arcade
Become a number ninja and slice through math challenges.
-
VIEW DETAILS
 Time Based
Challenge Match-Up Puzzles
Test your memory and matching skills in this engaging puzzle game.
Player vs Player Games
View all 12 games-
VIEW DETAILS
 Player vs Player
Challenge the City Stacker
Build a magnificent city by stacking colorful buildings.
-
VIEW DETAILS
 Player vs Player
Cooking Adventure
Get ready for a cooking adventure and satisfy hungry customers.
-
VIEW DETAILS
 Player vs Player
Experience Polyword
Dive into the world of polywords and solve challenging puzzles.
-
VIEW DETAILS
 Player vs Player
Dive into Arty Crafty
Let your artistic skills shine and create amazing crafts.
Fine Finger Movement Games
View all 9 games-
VIEW DETAILS
 Fine Finger Movement
Discover The Dancing Jungle
Shake, groove, and dance with the animals in the vibrant jungle.
Aiming and Precision Games
View all 6 games-
VIEW DETAILS
 Aiming and Precision
Feed The Bin: Toss Up
Feed the hungry bin by tossing objects accurately.
-
VIEW DETAILS
 Aiming and Precision
Dive into The Origami Aquarium
Dive into the world of origami with this aquarium game.
-
VIEW DETAILS
 Aiming and Precision
Ball Dunk: Toss Up
Test your skills and dunk balls in this toss up game.
-
VIEW DETAILS
 Aiming and Precision
Balloon Pop: Toss Up
Enjoy popping balloons in this exciting toss up game.
All Games
-
VIEW DETAILS
 Number Sense
Quickly Telling the Number of Things Up to 10 Game
In this exciting math game, kids will help cats escape by quickly telling the number of things up to 10 using dice patterns. This interactive adventure enhances counting and comparison skills, making subitizing fun and engaging. Perfect for young learners eager to boost their fluency in counting within 10. Ready to help the cats? Let's play!
-
VIEW DETAILS
 Addition
Adding Two Numbers (Up to 5) Game
Help your child master addition with this engaging game focused on adding numbers up to 5. Kids will enhance their problem-solving skills while practicing addition concepts in a fun and interactive way. The game encourages fluency in adding and subtracting, setting a strong foundation for future math success. Enjoy learning math with ease and excitement!
-
VIEW DETAILS
 Subtraction
Solving ''Take Apart'' Scenarios Game
In this engaging math game, kids will dive into subtraction word problems with "take apart" scenarios. They'll solve story-based situations, selecting numbers that complete the tasks. This interactive experience helps kids practice subtraction within 10, making math fun and relatable. Perfect for young learners eager to improve their addition and subtraction skills!
-
VIEW DETAILS
 Division
Dividing Objects into Equal Groups Game
Explore the world of division with this exciting game! Kids will learn to divide objects into equal groups, working with numbers up to 20. This engaging math adventure helps build essential skills in multiplication and division, making equal sharing a breeze. Perfect for young learners eager to tackle division challenges in a fun way!
-
VIEW DETAILS
 Decimals
Using Words to Identify Decimal Notations Game
This engaging math game invites kids to use words to identify decimal notations. By selecting the correct options, children practice writing hundredths as decimals. It's an exciting way to understand decimal notations while enhancing their math skills. Active participation ensures they grasp the topic with ease and confidence. Dive in and explore the world of decimals today!
-
VIEW DETAILS
 Time
TimeThe Minute Hand Game
In this fun math game, kids will explore the world of analog clocks by focusing on the minute hand. They'll solve exciting challenges to understand time better. This game helps young learners build confidence in reading clocks and telling time, making it a perfect way to boost their math skills. Get ready for a thrilling time-learning adventure!
-
VIEW DETAILS
 Money
MoneyRepresenting Money Using Symbols Game
In this exciting math game, kids tackle problems by representing money using symbols. They'll dive into identifying and counting coins like pennies, nickels, and dimes. By applying their prior knowledge, students will sharpen their skills in recognizing coin values and selecting the correct answers. Perfect for young learners eager to master money concepts!
-
VIEW DETAILS
 Word Problems
Word Problems on Counting by Tens Game
This fun math game helps kids tackle word problems by counting in tens. Students will use their place value knowledge to find answers, boosting their number sense. Perfect for young learners eager to explore the concept of 10 as a unit, this game makes learning math exciting and interactive. Watch your child's confidence in math grow as they play!
-
VIEW DETAILS
 Animals
Buffalo: Picture Perfect
Explore the world of buffalos in this picture perfect game.
-
VIEW DETAILS
 Kitchen
Kettle: Steaming Coloring Fun
Paint charming kettles with a burst of colors in this coloring adventure game.
-
VIEW DETAILS
 Space
SpaceAlien: Space Coloring Adventure
Let your imagination run wild and paint unique and colorful aliens in this adventure-packed coloring game.
-
VIEW DETAILS
 Objects
Toss Up
Challenge your accuracy and toss objects to hit various targets.
-
VIEW DETAILS
 Coloring
Magic Canvas Color Your Imagination
Let your imagination soar and create enchanting art on a magical canvas.
-
VIEW DETAILS
 Quiz
QuizDive into Get Set Quiz
Get ready to quiz yourself and challenge your knowledge in this interactive game.
-
VIEW DETAILS
 Memory
Peek A Boo
Peek-a-boo! Have fun and uncover surprises in this engaging game.
-
VIEW DETAILS
 Number Sense
Identifying Embedded Numbers Game
Join the adventure and help the cats escape by learning addition through identifying embedded numbers within 10. This engaging game offers smartly designed tasks that make math exciting and interactive for your young mathematician. Master addition and subtraction skills while having fun with patterns. Perfect for little geniuses ready to explore math! Get started now!
-
VIEW DETAILS
 Addition
Finding Sum (Up to 10) Game
This engaging math game helps kids practice addition by finding sums up to 10. With various levels of complexity, kids choose the correct answer from options, building confidence in math. Perfect for young learners, it enhances their ability to add numbers without visual aids, making math fun and interactive. Join the adventure and master addition today!
-
VIEW DETAILS
 Subtraction
Finding One Less Game
This fun math game guides your child to learn subtraction by finding one less than a given number. With interactive challenges, kids actively participate and grasp subtraction concepts easily. Perfect for budding mathematicians, it makes learning addition and subtraction enjoyable and effective. Encourage your child to explore numbers and improve their math skills today!
-
VIEW DETAILS
 Multiplication
Finding Equal Groups and Size of Group Game
Embark on a thrilling adventure with the brave prince as you help him unlock the secrets of a mysterious map. This engaging math game challenges kids to find equal groups and determine group sizes using visual aids. Perfect for building a strong foundation in multiplication, it enhances place value and number sense. Kids will enjoy learning math while having fun!
-
VIEW DETAILS
 Division
Using Models to Relate Multiplication and Division Game
Help kids overcome math misconceptions with this interactive game. Using visual models, children relate multiplication to division by creating division sentences from multiplication sentences. Perfect for practicing with numbers up to 20, this game builds confidence and enhances understanding of these key math concepts. Get ready for fun learning adventures!
-
VIEW DETAILS
 Fractions
Partitioning to Match the Fractions Game
Embark on a fun adventure where kids learn fractions by partitioning to match them. Help the hero create an equal path by activating rocks with the right fractions. This engaging game makes understanding and representing fractions a playful experience, boosting math skills in a creative way. Perfect for young learners eager to master fractions!
-
VIEW DETAILS
 Decimals
Filling in to Show Equivalence Between Mixed and Decimal Numbers Game
In this fun math game, kids will practice converting mixed numbers into decimal form. Through interactive challenges, children will understand decimal notations better and improve their problem-solving skills. This game offers a playful way to build confidence in dealing with decimals, making learning both enjoyable and effective.
-
VIEW DETAILS
 Geometry
Finding Shapes All Around Us Game
Get ready for a thrilling adventure at the amusement park! In this engaging game, kids will identify 2D shapes using real-world objects. Perfect for young learners, this game helps them become geometry experts. With interactive questions and visual aids, children will enjoy learning about shapes while having fun. Let the shape-finding journey begin!
-
VIEW DETAILS
 Data Handling
Sorting Objects by Color Game
In this exciting game, kindergartners will sort objects by color, enhancing their visual reasoning skills. They'll tackle fun challenges that help solidify their understanding of sorting, counting, and classifying objects. This interactive approach makes learning measurement and data concepts enjoyable and memorable for young learners.
-
VIEW DETAILS
 Measurement
Identifying Which Object Is Longer Game
In this engaging math game, kids will compare object lengths to determine which is longer. Perfect for young mathematicians, this game helps clear up misconceptions about measurement. Children will enjoy solving problems while learning key concepts like "longer," "shorter," and "equal." It's a playful way to boost their measurement skills. Get started now!
-
VIEW DETAILS
 Money
MoneyUsing Symbols to Represent Money Game
Join this exciting game where kids learn to represent money using symbols. They'll practice counting pennies, nickels, and dimes while solving fun problems. This game offers diverse challenges to enhance their money-counting skills. Perfect for young learners eager to understand and enjoy the basics of money. Let the fun begin!
-
VIEW DETAILS
 Algebra
Identifying the Equivalent Expression Game
In this exciting math game, kids will tackle problems involving addition and subtraction to identify equivalent expressions. By evaluating both sides of the equal sign, young learners will determine if the expressions are equivalent. The game offers a playful approach to mastering addition within 20 and builds crucial math skills. Get ready to learn and have fun!
-
VIEW DETAILS
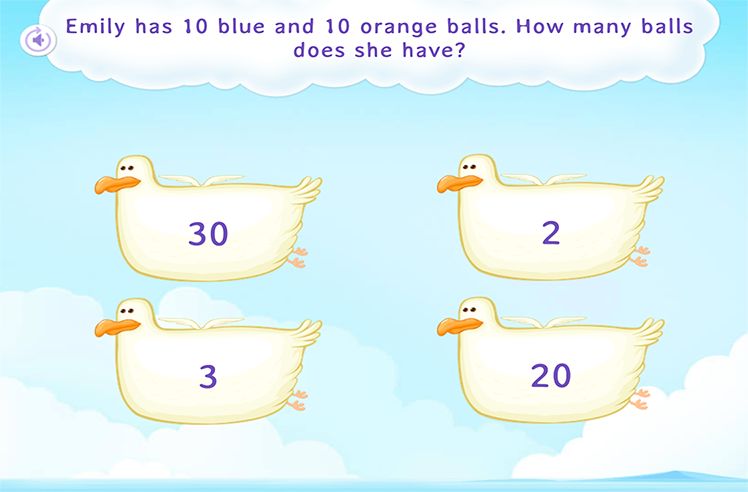
 Word Problems
Solving Word Problems Related to Multiplicative Comparison Game
In this exciting math game, kids will dive into solving word problems using multiplication. They'll explore real-world scenarios, tackling both additive and multiplicative comparisons. As they progress, students will sharpen their skills in understanding and applying multiplication in practical situations, making math fun and relevant. Perfect for young problem solvers!
-
VIEW DETAILS
 Food
FoodSmoothie: Chef Yum Yum
Mix and match ingredients to create tasty smoothies.
-
VIEW DETAILS
 Animals
Cat: Picture Perfect
Bring cats to life with colors in this picture perfect game.
-
VIEW DETAILS
 Seasonal
Birthday Party Coloring Adventure
Use your artistic skills to paint a vibrant birthday party scene and join the fun in this coloring adventure game.
-
VIEW DETAILS
 Kitchen
Explore Coloring Fun in the Toaster
Create a toasty masterpiece by painting colorful toasters.
-
VIEW DETAILS
 Space
SpaceMoon A Lunar Coloring Adventure
Explore the mysteries of the moon and paint captivating lunar landscapes with this cosmic coloring adventure.
-
VIEW DETAILS
 Toys
ToysMonster: Sneaky Shapes
Sharpen your observation skills and uncover hidden monster shapes in this fun and interactive game.
-
VIEW DETAILS
 Time Based
Hungry Monsters
Embark on a feeding frenzy and keep the hungry monsters happy in this engaging game.
-
VIEW DETAILS
 Addition
Solving 'Add To' Scenarios Game
This exciting game helps kids tackle "add to" scenarios with ease. Through engaging word problems, children practice addition within 10 while building confidence in math. The game offers a fun approach to learning, ensuring kids get the practice they need to become more comfortable with adding numbers. Perfect for young learners to sharpen their addition skills!

-

How do you help kids practice different educational concepts in the curriculum?
- Provide online printable worksheets such as Math worksheets and ELA worksheets for effective practice of essential concepts.
- Explore children’s learning games aligned with the curriculum and grade level. Include kids’ learning games in your child’s daily routine to offer hands-on learning and build a daily learning habit.
-
Are there any free trial options to test out these games?
-
How does SplashLearn ensure personalized learning through its online educational games?
The SplashLearn’s adaptive algorithm creates an individualized learning path for each child, suitable for their grade level and skills. This allows kids to learn at their own pace.
-
What age group are these games designed for?
SplashLearn games are suitable for ages 2 to 11. SplashLearn also serves as a valuable resource for older children with special needs, helping them bridge the gap to their grade level and master basics.
-
How can I make teaching fun for kids through games?
Teaching English and math concepts through children’s learning games can be really engaging and enjoyable for students. Including activities and online interactive games that promote critical thinking and creativity can truly help with in-depth learning of various concepts.
Your one stop solution for all grade learning needs.
Give your child the passion and confidence to learn anything on their own fearlessly


