
Watch your students’ understanding grow with our virtual manipulatives designed for Pre-K to Grade 5 teachers. Virtual manipulatives help explain hard concepts and complex ideas in a way kids can easily understand, making lessons come alive. Whether you’re teaching in the classroom or helping kids learn at home, our teacher-approved math manipulatives are here to make every lesson better. Try them and see the difference yourself! Start now for free!

Telling Time
Move the clock hands to match the time on a digital clock and an analog clock.
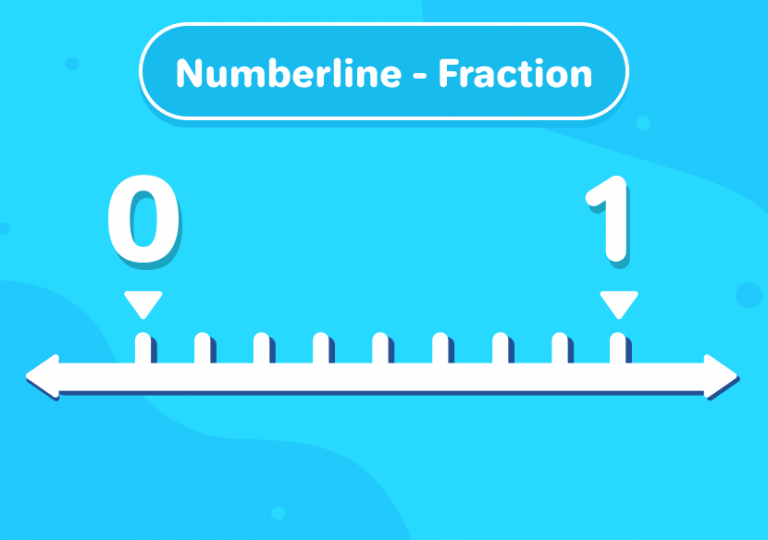
Fractions on a Number Line
Show fractions on a number line by manipulating the numerator and denominator.
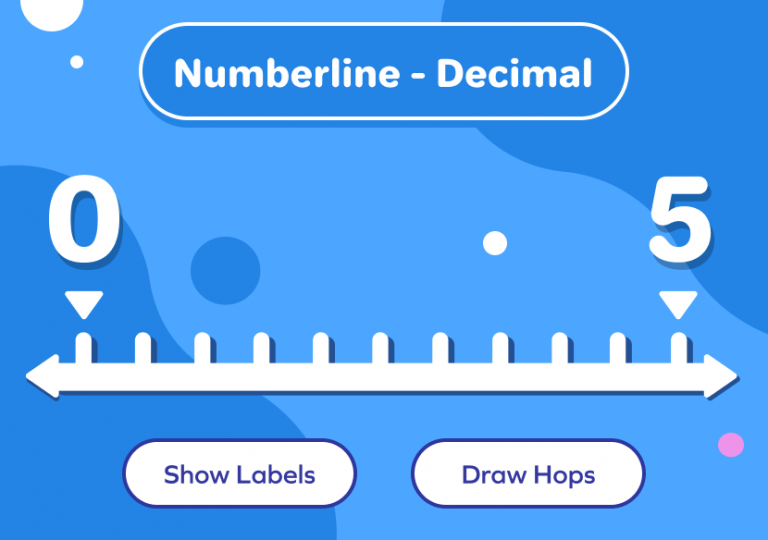
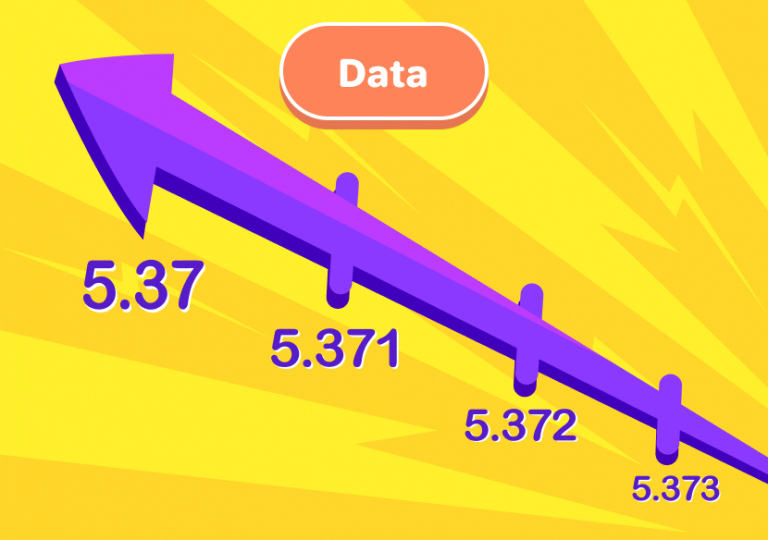
Decimals on a Number Line
Show decimals on a number line by setting the number of divisions and endpoints.
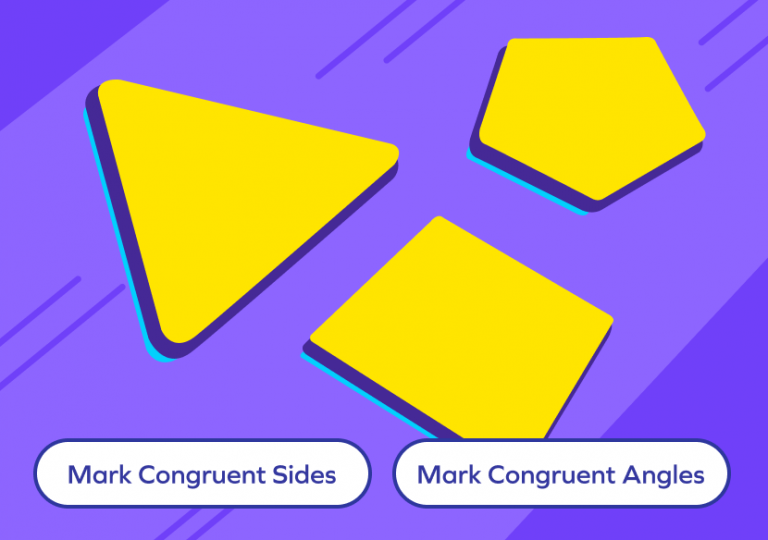
Two Dimensional Shapes
Visualize the types and properties of triangles, quadrilaterals, and polygons.
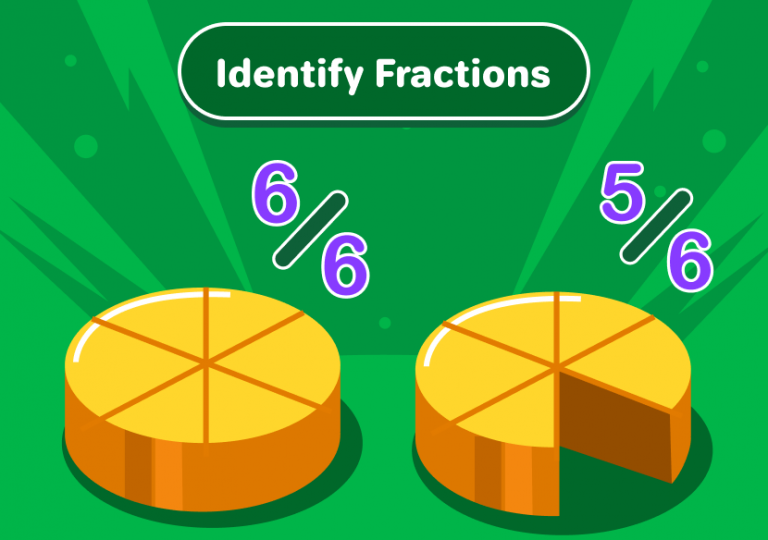
Model Fractions
Represent fractions and mixed numbers with visual models like strips and grids.
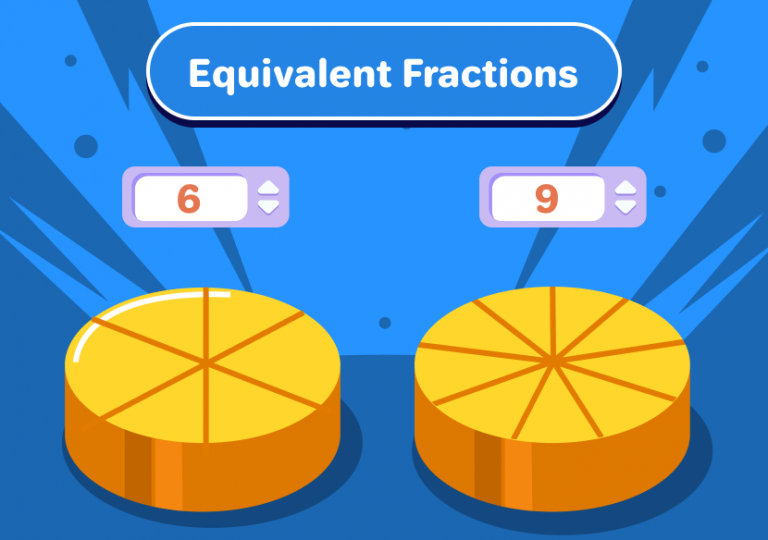
Equivalent Fractions
Teach equivalent fractions with models like fraction strips, grids, and circles.
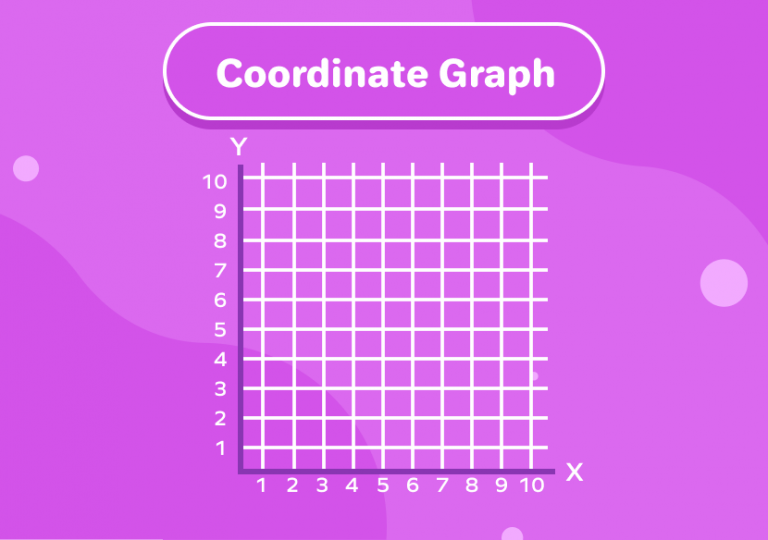
Coordinate Graphs
Learn to identify and plot the coordinates of points on the coordinate graph.
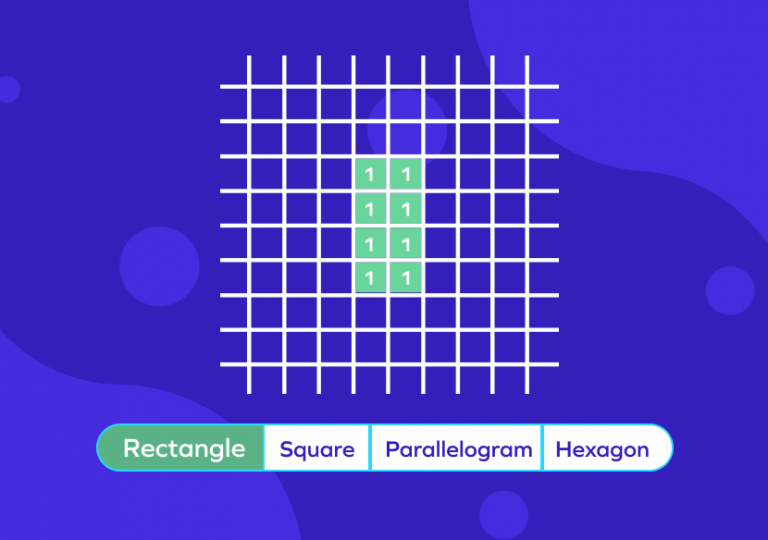
Area and Perimeter
Find the area and perimeter of simple shapes using unit squares and formulas.
Data and Charts – Line Plot
Draw line plots by defining your own data values, categories, and axis labels.
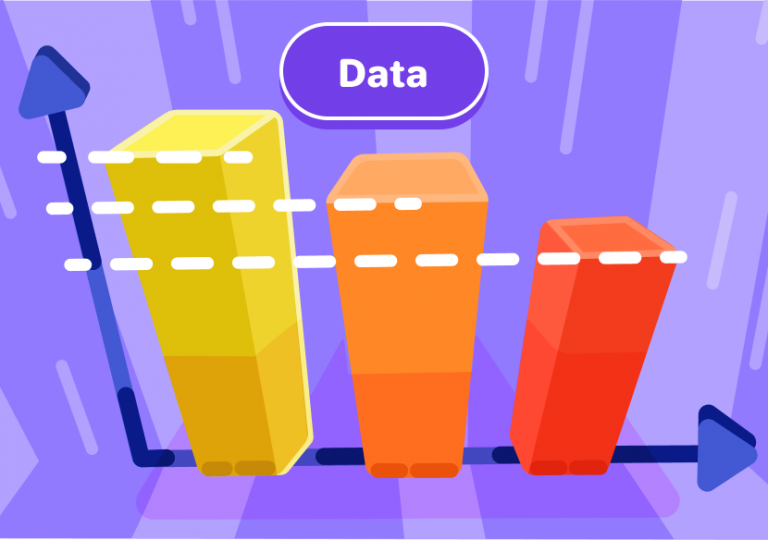
Data and Charts – Bar Graph
Draw bar graphs by defining your own data values, categories, and axis labels.
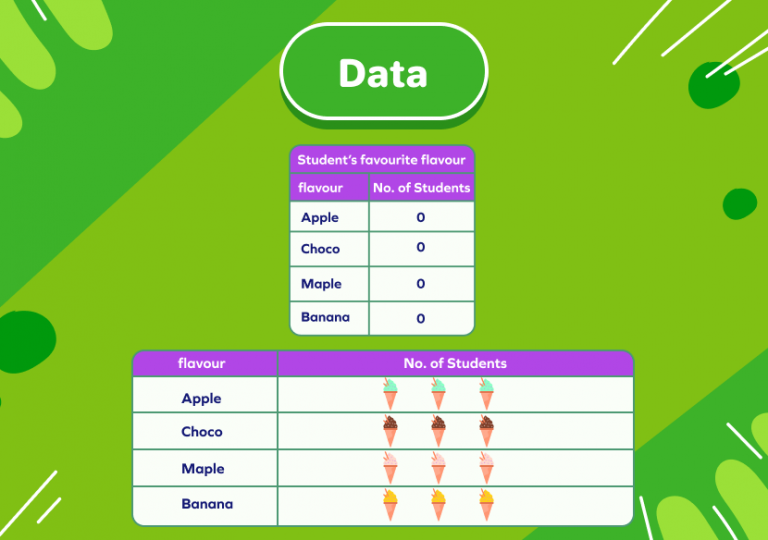
Data and Charts – Picture Graph
Create different picture graphs by defining your own data values.

Measuring Length
Use a ruler to measure lengths in inches, centimeters, and their fractions.