What is a linear graph?
It is a graphical representation that discusses the relationship between two or more quantities or things. The word ‘linear’ means straight. Linear graphs are straight line graphs to represent the relationship between two quantities.
This graph helps in depicting a result in single straight lines. There is no use of curves, dots, bars, etc., and a straight line is denoted by the term linear.
Let’s represent the given example in the form of a data table.
 v/s Distance (in meter)")
Recommended Games


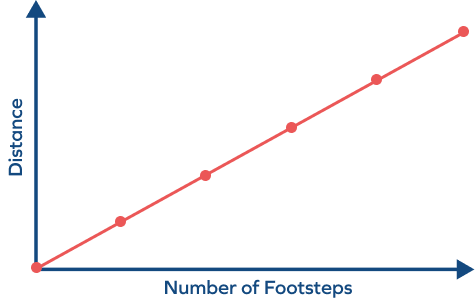
Representation
We can represent the distance covered by the object in the y-axis and the time in the x-axis. If we plot the data and join the coordinates, we obtain a straight line.
This type of graph is called a linear graph.

Different Parts of a Linear Graph

Y-axis: The Y-axis is in the vertical direction, and this is the axis that normally displays a measurement. All the measurements should be of equal distance in this segment if you want to count items such as boxes and ice creams.
X-axis: The X-axis lies on the horizontal line, on which it will represent common names, places, and dates, among other things that need to be analysed. For example, lunchtime, playtime, etc.
The title: When a reader looks at your graph, the first thing they notice is the title. The title should be crisp and to the point, and it should not mention anything useless. For example, the title “lunchboxes in school.” It can also include dates and other information in the graph.
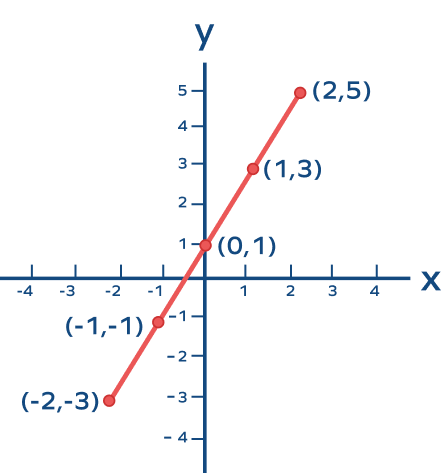
Linear Graph Equation
This graph forms a straight line and is denoted by the equation:
y = mx + c
where m is the gradient of the graph and c is the y-intercept of the graph.
The linear equation can also be written as,
ax + by + c = 0
where a, b and c are constants.
Properties of Linear Graph Equations
- A linear equation has two variables with many solutions.
- It can extend to an infinite number of points on the line.
- You can plot as many points as you like to draw this graph, but the minimum number of points needed to plot the correct graph is 2.
How to Plot a Linear Equation on a Graph
Step 1: Calculate the value of y with respect to x by using the given linear equation.
Step 2: Present these values in a tabular form.

Step 3: Plot the points given in the table in a graph.

Step 4: Join the points and draw a straight line.

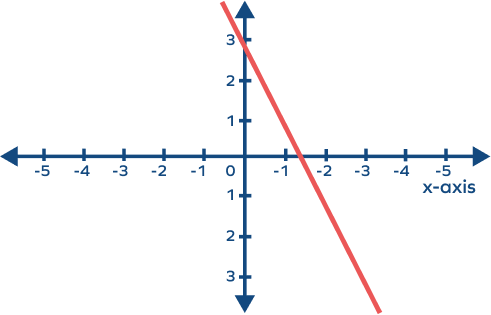
How Is a Linear Graph Different from a Line Graph?
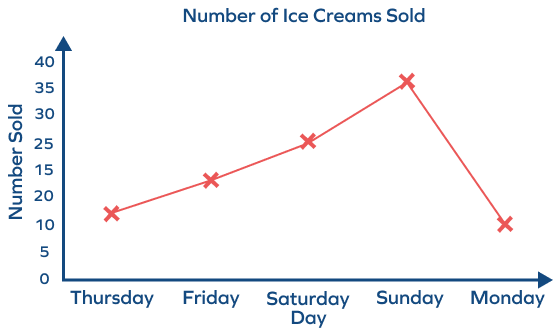
A. Line graph

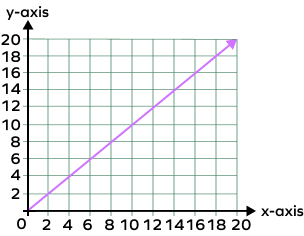
B. Linear graph

If we compare the two images, we can see that they are quite different. Graph A is a line graph, while graph B is a linear graph. Both these graphs are made up of line segments, but there is a difference between them.
The figure shows the difference after putting the results into a combination of line segments. In this graph all of the points are collinear, so they lie on a line, and this may or may not be the case in a line graph.
Solved Examples
Example 1: What is a graph with a single line called?
Solution: A graph with a single line is called a simple linear graph.
Example 2: All the points in a linear graph are_____________.
Solution: All the points in a linear graph are collinear.
Example 3: Substitute -2 for x and find the result for y in the equation y = 3x + 1.
Solution: y = 3x + 1
y = 3 (-2) + 1
y = -6 + 1
y = -5
Practice Problems
Linear Graph - Definition with Examples
Which of the following are NOT linear graph examples?
The coordinate points are not collinear.
Which of the following is NOT a linear equation?
This is a quadratic equation
Which of the following is the graph for the equation y = x?

According to the given equation x = y,
if x = 2, then y = 2. Graph c) follows the given relation
Conclusion
In this lesson, we learned about the use of linear graphs. Graphs can help us represent different activities using lines, and a linear graph is very different from a line graph. Graphs can be very useful for students to learn and understand many different things without getting confused.
Frequently Asked Questions
What are the different types of graphs used?
Different types of graphs used for representation are:
- Line graph
- Pie chart
- Bar
- Histogram
- Scatter plot
Does a linear graph pass through the origin?
No, a linear graph does not have to go through the origin. It should just be a straight line.
What is the difference between a linear graph and a non-linear graph?
The linear graph forms a straight line, whereas the non-linear graph has graphs with curved lines, dots, bars, etc.