Data is an essential component of many fields of study, including mathematics, business, economics, science, and statistics.
Mathematics presents one of the best ways to look at data to draw conclusions and make predictions about future behaviors based on past and current observations.
This article provides an overview of the definition of data in math, and it also explains what types of data exist within mathematics, along with some examples to help understand it better.
What Is Data in Math?
Data in math is a collection of facts and figures that can be in any form—numerical or non-numerical. Numerical data is the one you can calculate, and it is always collected in number form, such as scores of students in class, wages of workers in an organization or height of players on a football team, etc.
Non-numerical data is the one that can only be collected and not calculated, such as characteristics of someone, the physical appearance of an animal, or other observations not including numbers. Some examples would be the taste of a fruit, the color of a crayon, etc.
Let’s take a look at the types of data in math based on data type and collection method.
Recommended Games


Types of Data in Math
1. Based on Data Type
Qualitative Data
Qualitative data does not have a numerical value, but it contains various characteristics about objects or people, such as color, shape, etc. For example:

Quantitative Data
This is numerical data. It includes information like age, time, height, weight, etc. The data is collected by measuring it on required parameters.
For example, data on the number of students playing different sports from your class is in quantitative form.


2. Based on the Collection Method
Depending on the source, it can be classified as primary data or secondary data. Let’s explore them both.

Primary Data
Primary data is original information that has been collected for a specific purpose. It is the pure and raw form of data that has never been processed. It is organized in a structured way for future use.
Primary data can be qualitative or quantitative and cannot be derived from another source.
An example of primary data is the Census.
Secondary Data
Secondary data is sourced from an existing data source, either in an unpublished or published form. It is any data that has already been collected and is available for use by researchers. It could even be a primary data source.
Examples of such data are information found in government statistics, journals, etc.


Data Organization
Data organization is a simple practice of classifying and categorizing data to make it easy to understand. We can use folders, tables, graphs, and pie charts to organize data in math.
Table form: Data that is presented in a tabular form, using tables.
Graph form: Data presented via graphs to represent quantities.
Picture form: Any picture that can be used to derive qualitative data.

Solved Examples
Example 1: The daily wages of 10 construction workers are given below:
$\$$60, $\$$78, $\$$56, $\$$90, $\$$72,$\$$68, $\$$83, $\$$89, $\$$57, and $\$$93
Arrange the above data in ascending order.
Solution: The ascending order of the above data is: $\$$56, $\$$57, $\$$60, $\$$68, $\$$72, $\$$78, $\$$83, $\$$89, $\$$90, and $\$$93.
Example 2: The height (in feet and inches) of 12 boys in one class is measured as given below:
5’4’’, 4’10’’, 5’1’’, 4’9’’, 5’5’’, 4’4’’, 5’3’’, 4’3’’, 5, 5’2’’, 4, 4’11’’
Find the height of the shortest and tallest boy in the class.
Solution: 1 foot equals 12 inches.
Let’s arrange the data in ascending order to find the height of the shortest and the tallest boy:
4, 4’3’’, 4’4’’, 4’9’’, 4’10’’, 4’11’’, 5, 5’1’’, 5’2’’, 5’3’’, 5’4’’, 5’5’’
The height of the tallest boy is 5 feet 5 inches, and the height of the shortest boy is 4 feet.
Example 3. The following table shows the number of oranges sold by Mike at different times of the day. How many oranges did Mike sell in a day?

Solution: Since, $13 + 21 + 15 = 49$ oranges.
So, Mike sold a total of 49 oranges in a day.
Example 4. A class of students scored 70, 66, 48, 90, 87, 73, 58, 62, and 91 on a math test. Find the class average.
Solution: To find the class average, we must add all the scores and divide them by the number of students.
Here,
Total Number of Students $= 10$
Total Score $= 70 + 66 + 49 + 90 + 87 + 73 + 54 + 58 + 62 + 91 = 700$
Average Score $=$ Total Score $\div$ Total Students $= 700 \div 10 = 70$
So, the average score of the class is 70.
Practice Problems
Data - Definition with Examples
If Lucy earned the following points in the five rounds of a Math quiz, then determine in which round she scored the highest?(Each round was 100 points.)
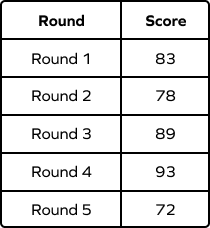
She scored 93 points in the round 4, which is the highest of all.
The given shows the number of cookies sold by different groups in a school fair. If they were all priced at $0.75 each, how much did Group A earn?
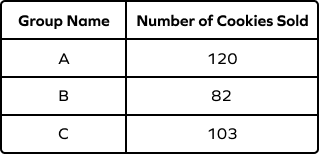
Since, Group A sold 120 cookies, money earned by the equals $120 \times 0.75= $\$$90$
The SAT scores of Mike, Stella, and John are given below. Whose total score is the highest?
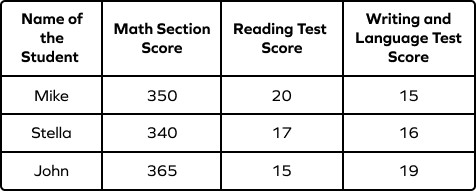
Mike's total score is $350 + 20 + 15 = 385$
Stella scored $340 + 17 + 16 = 373$
and John scored $365 + 15 + 19 = 399$
So, John’s total score is the highest.
We have the data of three pets$—$a dog, a cat, and a mouse. Which of the following is quantitative data related to these pets?
Since you can only count the number of teeth and not other traits like color and food choices.
Frequently Asked Questions
How can data be classified?
When we collect data for analysis or further processing, it is necessary to classify or categorize data. There are two methods of classifying data: qualitative and quantitative classification.
What is data interpretation?
Data interpretation means extracting information from data sets by analyzing and presenting them. Data interpretation gets easier if the data is presented through tables, graphs, or charts.
What is data visualization?
Data visualization means the representation of given data in the form of visuals. Some examples of this would be charts, graphs, and maps.
What is the difference between primary and secondary data?
Primary data is collected from the original source whereas secondary data is collected or derived from already collected data or primary data.