What Is a Range in Math?
The range of a data set is the difference between the greatest value and lowest value within a collection of numbers. Subtract the smallest from the greatest value in the set to find the range of given data points.
Range is a fundamental concept in statistics used to analyze data and make useful interpretations. What can you tell from the range about the data? It tells us the variability of the data or how the data points are spread or how far apart the highest value is from the lowest.
For example, the range of the data set $\left\{1,\; 3,\; 6,\; 8,\; 9\right\}$ is given by $9 \;-\; 1 = 8$.
Range: Definition
The definition of range in math can be given as the difference between the maximum value and minimum value within the set. Range is the simplest and quickest way to make sense of the given data points.
Example: What is the range of numbers $\left\{23,\; 27,\; 40,\; 18,\; 25\right\}$?
The largest value $= 34$
The smallest value $= 13$
Therefore, the range is $34 \;-\; 13 = 21$.
It tells us how far the greatest value of the set is from the smallest number. A wider range signifies substantial variability, whereas a narrower range shows low variability in a distribution.
Recommended Games
Formula for Finding Range of a Data Set
As mentioned earlier, the range of a set of numbers is the difference between the highest observation and the lowest observation in the given data. The formula to find the range in math can be given as:
Range = Highest value – Lowest value
Recommended Worksheets
How to Find Range
The range is calculated by subtracting the lowest value from the highest value. To identify the smallest and the greatest values easily, you can use the following steps.
Step 1: Write the given numbers in the ascending order (from the lowest to the highest).
Step 2: Note down the lowest and the highest values.
Step 3: Subtract the lowest value from the highest value.
Example: The given data shows the age of 8 participants of a local marathon. What is the range?
| Age | 39 | 13 | 27 | 29 | 21 | 42 | 57 | 36 |
Determine the lowest value (L) and greatest value by first sorting the data from low to high (H).
| Age | 13 LOWEST | 21 | 27 | 29 | 36 | 39 | 42 | 57 HIGHEST |
Subtract the lowest value from the highest.
Range $= 57 \;-\; 13 = 44$
Range between Two Numbers
If the data consists of only two numbers, then the range is simply the difference between the greater number and the smaller number.
Example: The range of the set $\left\{8,\; 12\right\}$ is $12 \;-\; 8 = 4$.
Comparing Data Sets Using Range
Let’s understand what kind of interpretations we can make to compare given data sets based on the range.
Example: The data recorded for the number of visitors for two museums in the recent week is given by
Museum A: 24, 26, 29, 29, 33, 34, 36
Museum B: 16, 24, 26, 26, 26, 27, 28
Range of the number of visitors for the museum $A = 36 \;-\; 24 = 12$
Range of the number of visitors for the museum $B = 28 \;-\; 16 = 12$
What is the best interpretation of range here?
It shows how far apart the lowest number of visitors and the highest number of visitors are. Also, we can say that the number of visitors for both the museums has the same variability.
Finding Range of a Data Set using Graphs
You can also determine range if a graph such as a bar graph or a scatter plot of the data set is given.
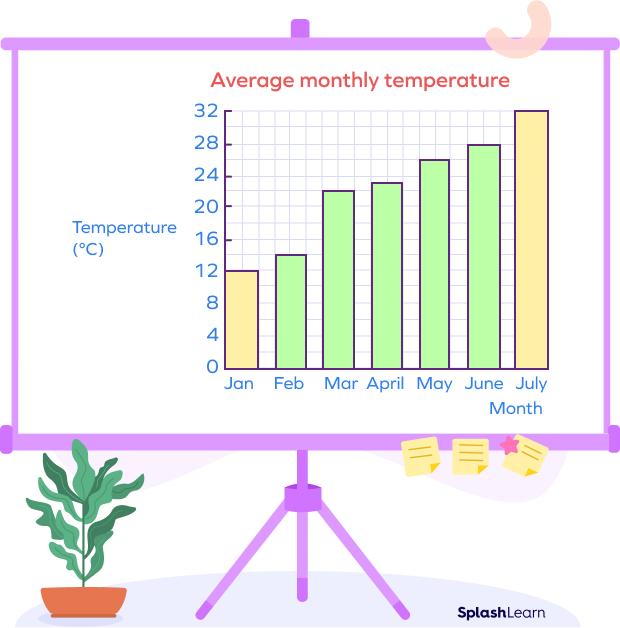
Example: A bar graph of the average monthly temperature (in degree celsius) for a particular city is given below.

Highest temperature is recorded in July, which is $32^\circ\;C$.
Lowest temperature is recorded in January, which is $12^\circ\;C$.
Range $= 30^\circ\;C \;-\; 12^\circ\;C = 18^\circ\;C$
Advantages or Merits of Range
- The range is used to instantly analyze broadly how the data is spread or to get an instant idea about the variability of the data.
- Range is the easiest way to make interpretations about the spread of the data.
- Range can be used in comparing small data sets having the same size.
- Easy to compute
- Range has great applications in quality control analysis.
Limitations of Range
1) Range is sometimes misleading, since it gets significantly affected by the outliers or fluctuations in the data. Extreme values have an impact on the range.
Example: The range of $3,\; 5,\; 7,\; 9$ is $9 \;-\; 3 = 6$
However, the range of $3,\; 5,\; 7,\; 9,\; 350$ is $350 \;-\; 3 = 347$
Here, almost all values are less than 10, but the range is large due to the outlier 350.
2) Range is calculated only by two points in the data. It does not use all the data points.
3) The range does not help us to comment about the structure of the data set. You cannot know how many data points are there or how all the data points are spread using the range.
Range of a Function
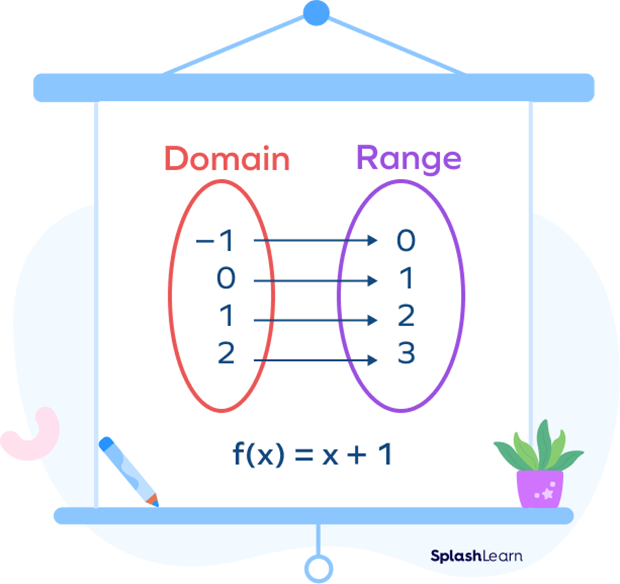
What does range mean in algebra? Range in the context of algebra refers to the range of a function. The range of the function $y = f(x)$ is the set of all the possible output values (y-values).
Example: For the function $f(x) = x + 1$ defined over the set $\left\{-1,\; 0,\; 1,\; 2\right\}$, the range is given by the set $\left\{0,\; 1,\; 2,\; 3\right\}$.

Finding Range of a Function from Graph
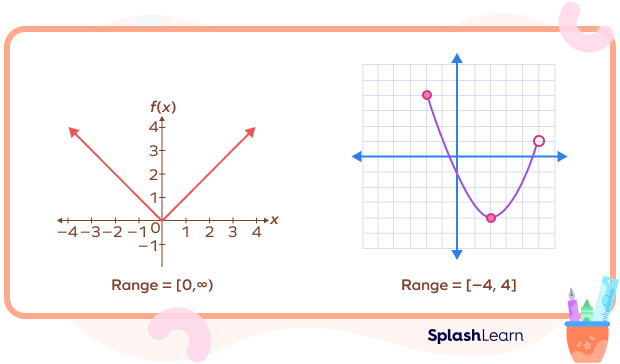
The graph of a function can be used to identify the range of a function. The y-axis of a graph represents the potential output values. If the graph goes on beyond the portion or region of the paper, the range is greater than the visible values.
In the image given below, there are two graphs.
1) The graph on the left ranges from 0 and above. The lowest output value is 0. The highest output value cannot be determined since the graph goes on forever.
Thus, the range is [0, ).
Square bracket indicates that 0 is included in the range.
2) The graph on the right ranges from $-4$ to $+4$. The lowest y-value is $-4$. The highest value is 4.
Thus, the range is $\left[-4,\; 4\right]$.

3) The range of a constant function $f(x) = c$ is given by the set $\left\{c\right\}$.
Conclusion
In this article, we learned about the range, its formula, comparing data sets using the range along with its merits and limitations. Let’s solve a few examples and practice problems!
Solved Examples on Range
1. On his summer vacation, Alex traveled through 8 different states. He recorded the cost of a water bottle in each state. What is the range?
$\$2.79,\; \$1.61,\; \$2.96,\; \$3.09,\; \$1.64,\; \$2.25,\; \$3.73,\; \$1.67$
Solution:
Write the prices in the ascending order.
1.61, 1.64, 1.67, 2.25, 2.96, 2.79, 3.09, 3.73
Range $= $Highest value $–$ Lowest value $= 3.73 \;–\; 1.61 = \$2.12$
The range of the price is $\$2.12$
2. What is the range of numbers in the set $\left\{8,\; 12,\; 23,\;17,\; 21, \;and\; 15\right\}$?
Solution:
Data set $= \left\{8, 12, 15, 17, 21, 23\right\}$
Data rearranged in ascending order is given by
8, 12, 15, 17, 21, 23
Lowest data value $= 8$
Highest data value $= 23$
Range $=$ Highest value $–$ Lowest value
Range $= 23 \;–\; 8$
Range $= 15$
Hence, the range of the given data set $= 15$
3. What is the range of the set of natural numbers less than 15?
Solution:
Natural numbers start from 1.
Natural numbers less than $15 = \left\{1,\; 2,\; 3,\; 4,\; 5,\; 6,\; 7,\; 8,\; 9,\; 10,\; 11,\; 12,\; 13,\; 14\right\}$
Lowest value $= 1$
Highest value $= 14$
Range $=$ Highest value $–$ Lowest value
Range $= 14 \;–\; 1$
Range $= 13$
Practice Questions on Range
Range in Math - Definition, Formula, Examples, Facts, FAQs
Find the range: 150, 250, 825, 230, 125, 500.
The largest value is 825. The smallest value is 18
Range $=$ Largest value $−$ Smallest value $= 825 \;−\; 125 = 700$
The formula for finding range is
Range $=$ Largest value$ \;−\;$ Smallest value
Based on the data points 5, 2, 6, 9, 15, 25, 22, we can say that
Lowest value $= 2$
Highest value $= 25$
Range $=$ Largest value $−$ Smallest value $= 23$
What is the range of a function $f(x) = 1$?
The function $f(x) = 1$ is a constant function.
Thus, the range includes a single number, 1.
Range $= \left\{1\right\}$
Frequently Asked Questions on Range
What are quartiles in statistics?
Quartiles are the points (a set of three points) that divide the data into four equal parts or quarters. The first, second, and third quartile is represented by $Q_1,\; Q_2$, and $Q_3$ respectively.
What is the interquartile range?
The interquartile range (IQR) is the difference between the upper quartile $(Q_3)$ and the lower quartile $(Q_1)$. $IQR = Q_3 \;−\; Q_1$
What is the difference between mean and range?
Mean is the average of all the numbers in the given data. It is the best way to analyze the central tendency of the data. It uses all the data points. Range is the difference between the largest number and the smallest number. It gives a broad idea about the spread of the data. It only uses two points.


