What Is a Tally Chart?
A tally chart or a tally table is a simple and visual method of data representation, often used to record and count occurrences of items or events. It conveniently displays the occurrence of an event, making calculations simple.
In a tally chart, tally marks represent individual items or frequency. They are frequently used for tasks like taking attendance, collecting survey data, or keeping track of scores. A tally table in math offers a quick and efficient way to organize and visualize data, especially when dealing with smaller quantities or when simplicity and rapid data collection are priorities.
Example: Here’s a tally chart created by surveying the favorite color of 20 children.

Recommended Games


Tally Chart: Definition
A tally chart in math is a simple tabular way of recording and counting frequencies in a dataset with the help of tally marks.


What Is Frequency in a Tally Chart?
Before learning how to make or read a tally chart in math, let’s learn about frequency.
Frequency is the occurrence of an event. The number of times a particular entry is occurring denotes the frequency of that entry.
You need to track this frequency on a tally chart. This track will be recorded in a set of 5 with the help of tally marks.
What Are Tally Marks?
Tally marks are a form of numeral used for counting. Tally marks are used for counting or recording frequencies. Tally Marks are used to record frequency in groups of five or keep track of numbers as quickly as possible.
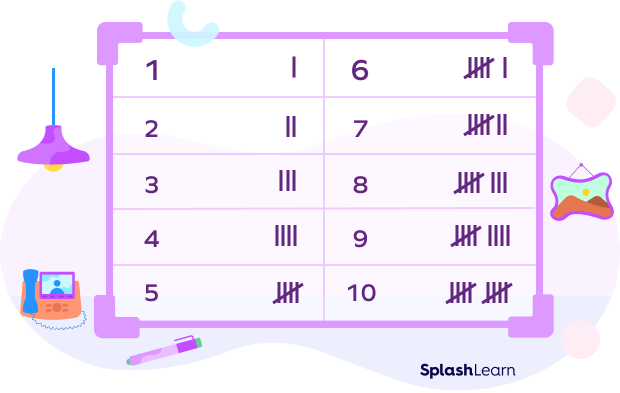
Tally marks are standing and slanted lines. Each line is used to represent each occurrence. They are represented in the set of 5, in which a straight line (tally symbol: |) is drawn for up to four occurrences, and the fifth occurrence of an event is represented as a slanted line over the earlier four lines.

The given table shows tally marks for numbers 1–10.
How to Read Frequencies in a Tally Chart
- In tally marks, the first four counts are typically represented by vertical lines like “|”.
- Every fifth tally mark is typically drawn diagonally across the preceding four vertical lines.
In summary, the first four lines are drawn vertically, and each fifth line runs diagonally over the previous four vertical lines. Here is a chart that will help you understand how we count tally marks:

How to Make a Tally Chart
A tally chart is a straightforward method of representing data using tally marks organized in a table. It is a quick and efficient way of recording information, simplifying data collection using tally marks instead of repeatedly writing words or figures.
Tally charts facilitate the immediate categorization of data for analysis. Grouping frequencies in sets of five makes it more convenient to calculate the total at the end. Tally charts provide a clear overview of data and are particularly useful for tracking numbers in sets of five.
Here are steps to create tally charts:
- Define categories: Based on the raw data, identify the categories of items you want to tally and create a table with columns to represent them.
- Write tally marks: For each occurrence of an item within a category, draw vertical lines or tally marks in the corresponding column. After every fifth mark, add a diagonal line to group them.
- Find the total: When you’ve collected your data, count the tally marks within each category to determine the total for each. This information can be used for further analysis.
Let’s understand how to make a tally chart with the help of examples.
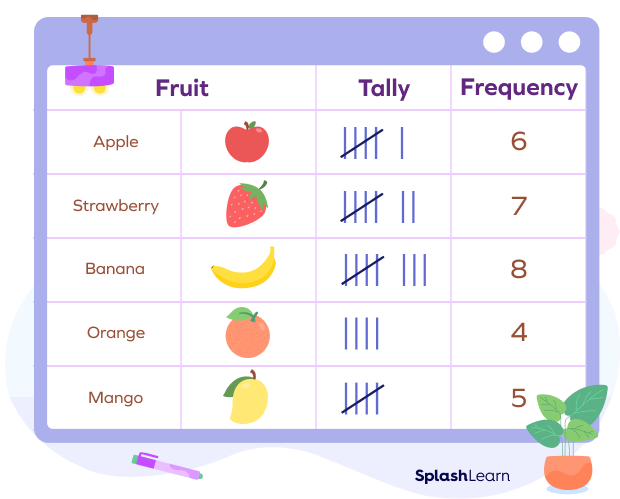
Example 1: Ms. Smith records the favorite fruit of every student in her class of 30. The data collection looks like this:
Apple, Orange, Grapes, Strawberry, Banana, Strawberry, Grapes, Apple, Apple, Banana, Apple, Banana, Strawberry, Apple, Banana, Grapes, Apple, Orange, Strawberry, Grapes, Orange, Banana, Strawberry, Strawberry, Strawberry, Banana, Banana, Orange, Banana, Grapes.
Here, the different fruits make 5 categories — Apple, Orange, Grapes, Strawberry, and Banana.
Here’s a tally chart that represents the given data:
How to Solve Questions Using Tally Charts
Let’s take an example. Suppose your school teacher has a list of scores of different students on a quiz and needs to understand the information like how many students got the highest score or how many got more than a passing score. What should she do? She can simply use a tally chart!
Suppose there are 30 students in your class. The given data represents the number of points scored by each student in a quiz:
36 15 30 17 16 15 17 20 30 35 18 27 25 18 30 25 18 30 28 25 35 28 30 28 25 36 35 30 25 36
You have to answer the following questions:
- How many students got more than 20 points?
- How many students got the highest number of points?
- How many students fail the quiz if the passing points are 20?
The given data is raw. A tally table is used to simplify and organize such data. We will identify the number of students (frequencies) corresponding to the points mentioned in the list (categories).
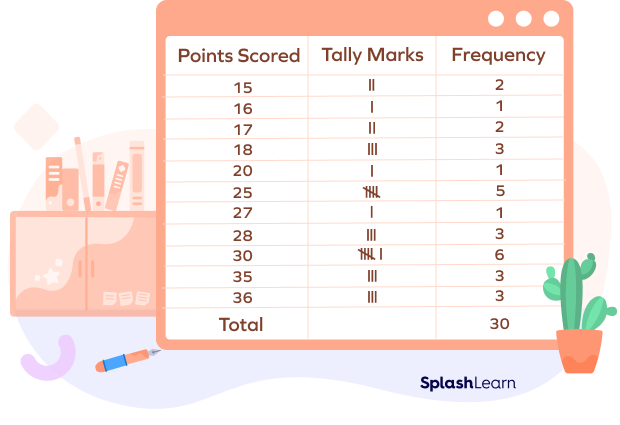
Now, we can easily analyze the chart and answer the questions.
- To find the number of students who scored more than 20 points, we will add the frequencies corresponding to the scores 25, 27, 28, 30, 35, and 36. The frequencies are 5, 1, 3, 6, 3, and 3 respectively.
5 + 1 + 3 + 6 + 3 + 3 = 21
Thus, 21 students scored more than 20 points.
- Here, we need to find the number of students who scored the highest marks.
The highest score in the class is 36, and the corresponding frequency is 3.
Thus, 3 students scored the highest number of points.
- Here, we need to find the number of students who failed the quiz if the passing score is 20.
Let’s count the frequencies corresponding to the points that are less than 20.
2 + 1 + 2 + 3 = 8
Thus, 8 students failed the quiz.
Facts about Tally Charts
- A tally stick is an ancient device employed to record numbers or documents. The term “tally” is derived from the Latin word “Talea,” meaning ‘twig’ or ‘cutting.’
- Tally marks are also called hash marks.
- When we mark off four lines using a diagonal fifth line, this pattern is called a “Five-Bar Gate.”
Conclusion
In this article, we learned about tally charts. We discussed essential definitions, how to make a tally chart, and how to solve tally table examples. Let’s dive into some solved examples and practice MCQs for better comprehension. Happy solving!
Solved Examples on Tally Charts
1. The given tally chart represents the favorite vegetables of 84 kids. Read the chart and answer the following questions:
- Which vegetable is the least favorite among the students?
- Which vegetable is the most favored among the students?
- How many students voted yellow capsicum as their favorite vegetable?

Solution:
By reading the tally marks, we can calculate the frequencies easily.
| Vegetable | Calculation | Frequency |
|---|---|---|
| Tomato | 4 × 5 = 20 | 20 |
| Yellow Capsicum | 3 × 5 = 15 | 15 |
| Cucumber | (2 × 5) + 2 = 17 | 12 |
| Onion | (3 × 5) + 3 = 18 | 18 |
| Eggplant | (1 × 5) + 1 = 6 | 6 |
| Gourd | (2 × 5) + 3 = 13 | 13 |
| Total = 84 |
- Eggplant is the least favorite vegetable among the students. Only 6 students chose it. It’s in one group of tally marks plus one individual mark.
So, 5 + 1 = 6.
- Tomato is the most favorite vegetable among the students. 20 students voted for it.
- Yellow capsicum is the favorite vegetable of 15 students.
2. A group of students participated in a survey. The tally chart represents the mode of transport used by students to go to the university.

- How many students go to the university by bus?
- How many students participated in the survey?
Solution:
1. Number of students that go to the university by bus = (4 × 5) + 2 = 20 + 2 = 22
2. To find the total number of students who participated in the survey, we will count the individual frequencies and add them together.
- Number of students that go by walk = (3 × 5) + 2 = 17
- Number of students that go by bus = (4 × 5) + 1 = 20 + 2 = 22
- Number of students that go by cycle = 5
- Number of students that go by car = 5 + 4 = 9
Number of students that participated in the survey = 17 + 22 + 5 + 9 = 53
3. Mona counted the number of black cars parked in the garage using tally marks. How many black cars are parked in the garage?

Solution:
Four tally marks crossed diagonally by another line collectively represent the count of 5.
There are 10 groups, each having 5 tally marks.
5 × 10 = 50
Thus, there are 50 black cars parked in the garage.
4. Scores made by Mike on 20 tests:
6 1 2 6 5 4 6 2 3 5 4 2 3 4 2 1 4 2 3 1
Make a tally table of the data and answer the following questions.
- How many times did he score 6?
- How many times did he score less than 3?
- How many times did he score a 4?
Solution:

- It is clear from the table that he scored 6 points in 3 tests. As there are three lines in the table corresponding to the score 6.
- He scored less than 3 points in 8 tests. Here, we find the sum of the frequencies corresponding to scores 2 and 1.
3 + 5 = 8
- He scored 4 points in 4 tests.
5. Read the tally table representing the points scored by 35 students in a test and answer the following questions.

- How many students scored more than 8 points?
- How many students failed the quiz if the passing score was 4 points?
- How many students scored the highest points?
Solution:
- Only 2 students scored more than 8 points.
- The passing score is 4 points. To find the number of students who failed the test, we add the frequencies corresponding to the scores less than 4 points.
1 + 4 + 2 = 7
Thus, 7 students failed the test.
- The highest score is 10. The corresponding frequency is 1.
Thus, only one student scored the highest number of points.
6. The given data represents the ages of 30 people in a building. Make a tally table and answer the following questions:
5 17 30 5 40 17 51 5 62 65 48 23 5 51 17 40 62 65 48 23 30 5 40 30 17 23 39 62 65 48
- How many people are below 18 years?
- How many people are aged between 20 and 40 years?
- How many people are over 30 years of age?
Solution:

- The ages below 18 are 5 and 17.
The frequencies corresponding to these ages are 5 and 4, respectively.
5 + 4 = 9
Thus, 9 people are under 18 years old.
- The ages between 20 and 40 are 23, 30, and 39.
The corresponding frequencies are 3, 3, and 1.
3 + 3 + 1 = 7
So, 7 people are between 20 and 40 years of age.
- The ages above 30 are 39, 40, 48, 51, 62, and 65.
The corresponding frequencies are 1, 3, 3, 2, 3, and 3.
1 + 3 + 3 + 2 + 3 + 3 = 15
So, 15 people are over 30.
Practice Problems on Tally Charts
Tally Table - Definition with Examples
Read the table representing the number of siblings of 23 kids and answer the following question. How many people have more than 2 siblings?
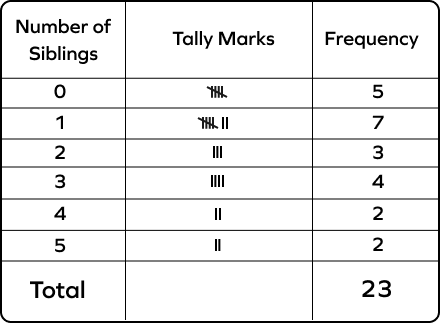
More than 2 means 3, 4, and 5.
The corresponding frequencies are 4, 2, and 2.
4 + 2 + 2 = 8
The given tally chart represents the number of toys a toddler owns in different colors. Read the table and answer the following question. How many red toys does the toddler have?
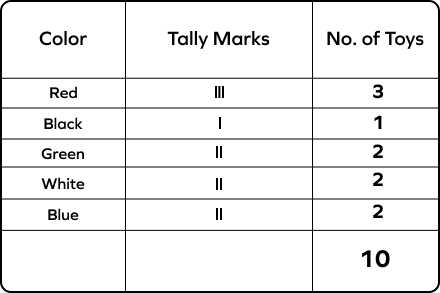
There are three lines in the tally table corresponding to the “red” category.
The tally chart represents the different candy bars with students. Read the table and answer the question: How many students have a Twix bar?
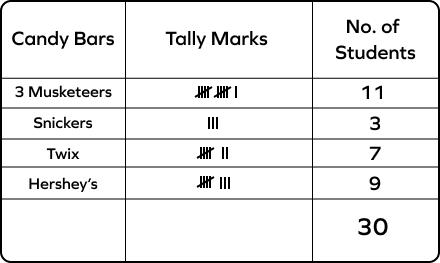
The tally table has 7 lines in front of the “Twix” category. Thus, 7 kids have a Twix bar.
Frequently Asked Questions about Tally Charts
Why do we use a tally table to keep records?
We use a tally table to keep records as it offers an organized way to read and understand the information. It reduces the chances of error in the analysis of the data.
What does tally mean in Math?
Tally helps keep count by drawing marks in Math. Every fifth mark is drawn across the previous 4 marks, so you can easily see groups of 5.
What is the difference between tally marks and tally charts?
A tally chart is a table with tally marks representing frequencies in a data set. A tally chart is one method of collecting and recording data with tally marks.
What does a diagonal line in a tally chart indicate?
A diagonal line in a tally chart groups four individual tally marks, representing a count of five.