What Are Tally Marks?
Tally marks is a simple technique to record a number of objects and to keep track of counting in groups of five. This makes counting easier and faster.
The word “tally” comes from the Latin word “Talea” which means ‘twig, cutting.’ In ancient times, people used twigs or tally sticks for the purpose of counting and as a memory aid device. They also carved tally marks on the walls of caves supposedly for keeping track of the number of animals or other important possessions.

Tally marks are considered to be a form or an application of a Unary numeral system since it uses only one symbol to represent numbers.
Recommended Games
How to Count Tally Marks
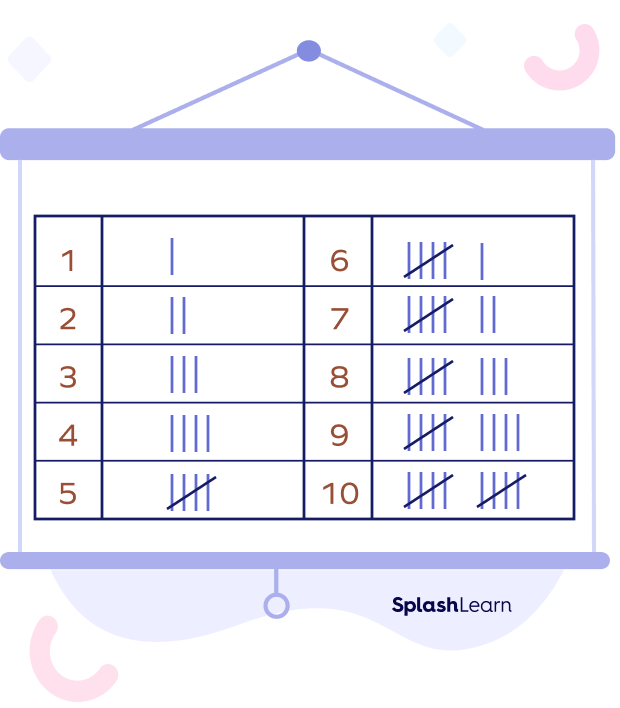
- When using tally marks, the first four counts are represented by vertical lines like “|”.
Tally marks for 1 to 4:

- Every fifth tally mark is written diagonally across the first four vertical lines.

When we cross off four lines by the fifth line diagonally, it is called a “Five-Bar Gate.”
- When count of 5 is completed, we start over in the same way.
So, a group of 5 tally marks and a single tally mark represents a count of 6, and so on.
Here’s a table for 10 tally marks:

You can create your own chart for tally marks 1 to 100 with the help of this table. Try it out!
Recommended Worksheets
Tally Marks Chart
Tally charts or tally tables are a tabular representation of data using tally marks. In the tally chart, tally marks represent frequencies.
Example 1:

Example 2: A medical survey recorded the color of eyes of 30 people using a tally mark chart.

Let’s read it.
- 6 people have green eyes.
- 8 people have blue eyes.
- 12 people have gray eyes.
- 4 people have brown eyes.
Uses of Tally Marks
- Counting and keeping track of your count
- Collecting data and representing them in an organized way.
- To represent frequency of observations in ungrouped or raw data
- To record data in surveys
Facts about Tally Marks
- Human beings have been using tally counting for thousands of years now.
- In ancient times, people used notched sticks or tally sticks for tally counting.
- The oldest notched sticks are believed to be 25000 to 35000 years old.
Conclusion
In this article, we learned about the significance of tally marks as a simple counting method used to represent data. Tally marks provide an efficient way to organize and visualize information. To deepen your understanding, let’s explore a few examples and test your knowledge with some interactive MCQs for improved comprehension.
Solved Examples on Tally Marks
Example 1: What is the number represented by the given tally marks?

Solution:
The given tally marks have three sets of 5 lines each and 2 individual tally marks.
When we represent them as numbers, we get
5 + 5 + 5 + 2 = 17.
Example 2: Write the tally marks for 1 to 20.
Solution:
Here is a chart that shows tally marks for numbers 1 to 20.
Tally marks 1 to 20:

Example 3: Represent the number of sides of each polygon shape using tally marks.

Solution:
We first arrange the given shapes in a table form. Then we represent their number of sides using tally marks as shown in the figure below:

Example 4: Write the tally marks chart for the number of candies of each type.

Solution: We count the two different types of candies. Here we have 6 lollipop candies and 8 normal candies. We can write their tally marks and total numbers as follows:

Practice Problems on Tally Marks
Tally Marks - Definition, Chart, Uses, Facts, Examples, FAQs
Which of the following tally marks represent 13?

We need two sets having 5 lines each and 3 individual tally marks.
When we add them, we get $5 + 5 + 3 = 13$.
Tally marks in the tally chart represents
In the tally charts, the tally marks represent the frequency of each observation.
What frequency does the given tally marks represent?

The given tally marks have 4 sets of 5 lines each and a single tally mark. This means it represents $5 + 5 + 5 + 5 + 1 = 21$.
Frequently Asked Question on Tally Marks
Why are tally marks typically organized in groups of 5?
Tally marks are organized in groups of 5 for easy readability. The group size of 5 enables easy conversion into decimal while performing higher arithmetic operations. If the number is large, it becomes easy to count in groups of 5.
What do we call a cluster of five lines where the fifth line diagonally crosses the previous four lines?
When a cluster of five lines has the fifth line diagonally crossing the previous four lines, we call it a five-bar gate.
Are there other ways to represent tally marks apart from the cluster of five lines method?
There are other ways to represent tally marks apart from the cluster of five lines method, such as the dot-dash tally.


