What Is a Number Chart in Math?
A number chart as a list of numbers that are written in a particular numerical order.
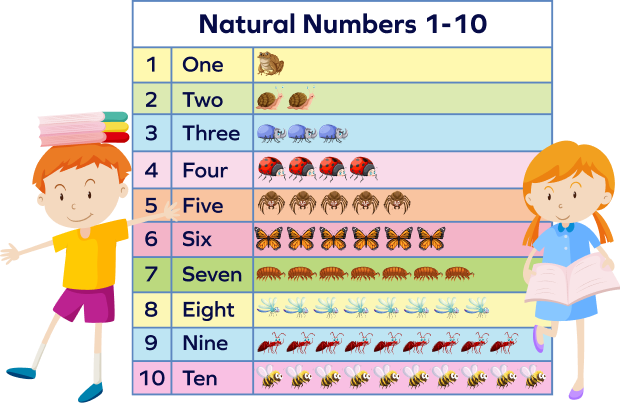
For example, if natural or counting numbers from 1 to 10 are listed in the form of a grid, it forms a number chart 1 to 10. Similarly, a number grid 1 to 100 would contain all the numbers from 1 to 100.
A number chart is a graphical representation of numbers arranged in a specific order. It helps in visualizing number patterns, sequences, and relationships. Number charts are valuable tools for teaching counting, number recognition, and basic mathematical concepts. They are often used by teachers to aid in early number learning.
A number chart does not necessarily have to be a list of natural numbers or whole numbers. It can be a list of even numbers, odd numbers, and so on.
Recommended Games
Types of Number Charts
There are different types of number charts that help kids in identifying the number patterns. Following are the different types of number charts:
Even Numbers Chart
“Even numbers” are numbers divisible by 2.
Examples: 2, 4, 6, 8, etc.
Here’s a number chart representing even numbers from 1 to 20:

Odd Numbers Chart
The numbers that are not divisible by 2 are called “odd numbers.”
Examples: 1, 3, 5, 7, and so on.
Here’s a number chart representing off numbers from 1 to 20:

Prime Numbers Chart
Prime numbers have only two factors, 1 and the number itself.
Example: 2, 3, 5, 7, 11, and so on.
(0 and 1 are not prime numbers.)
Here’s a number chart representing prime numbers between 1 to 20:

Composite Numbers Chart
Composite numbers are simply the numbers that are not prime. Composite numbers have more than two factors.
Example: 4, 6, 8, 9, 10, and so on.
(0 and 1 are not composite numbers.)

Natural Numbers Chart
Natural numbers are used for counting or ordering. Natural numbers start from 1. They do not include 0.
The chart that represents these numbers is known as the natural numbers chart.


How to Make a Number Chart
We can create a number chart by using a few simple steps.
- Decide the Range and Pattern: Determine the range of numbers you want to include in your chart. For instance, you might choose to create a chart for numbers 1 to 100 or a chart of multiples of 6 between 1-100.
- Prepare a Grid: Draw a grid on a piece of paper or use a digital tool. Divide the grid into rows and columns based on your chosen range. Label the rows and columns with appropriate headings.
- Fill in the Numbers: Begin filling in the numbers in numerical order, starting from the first row and moving across the columns. For example, the first row might contain numbers 1 to 10, the second row 11 to 20, and so on.
- Maintain Order: Ensure that you place the numbers in the correct order, following the sequence as you move across the rows and columns.
- Add Visuals (Optional): To make the chart more engaging, you can use colors, shapes, or illustrations. These can help highlight patterns or make the chart visually appealing, especially for young learners.
- Label the Chart: Add a title to your number chart that indicates the range of numbers it represents. This helps viewers understand the purpose of the chart.
Number Chart in Words
We can also write the numbers in words to make it easy to understand how to read the numerical.
The given chart shows the numbers from 1 to 20, along with the number words.

Number Chart Patterns
We observe different patterns in number charts such as even numbers, odd numbers, counting by 3’s, counting by 10’s and so on.
- Counting by 2 Chart
Let’s understand how to count by 2. If you start from 0 and take equal jumps of 2, you will land on even numbers 2, 4, 6, 8, and so on.
0 + 2 = 2; 2 + 2 = 4; 4 + 2 = 6; 6 + 2 = 8; and so on
Thus, skip counting by 2 gives us the list of even numbers.
| 1 | 11 | 21 | 31 | 41 |
| 2 | 12 | 22 | 32 | 42 |
| 3 | 13 | 23 | 33 | 43 |
| 4 | 14 | 24 | 34 | 44 |
| 5 | 15 | 25 | 35 | 45 |
| 6 | 16 | 26 | 36 | 46 |
| 7 | 17 | 27 | 37 | 47 |
| 8 | 18 | 28 | 38 | 48 |
| 9 | 19 | 29 | 39 | 49 |
| 10 | 20 | 30 | 40 | 50 |
- Counting by 3 Chart
Here’s a number chart representing the skip counting by 3’s pattern.

- Counting by 8 Chart:
Here’s a number chart that shows the skip counting by 8’s pattern:

Facts about Number Charts
- Number charts help kids learn counting and number sequencing.
- They provide a visual representation of number patterns and relationships.
- These charts assist children in recognizing numerals and understanding numerical order.
- Number charts can be used to introduce addition, subtraction, and skip counting.
- Kids can identify patterns, even and odd numbers, and multiples using number charts.
- Number charts are available in various formats, such as grids, tables, and interactive digital versions.
Conclusion
In this article, we explored the concept of number charts, which serve as valuable tools for teaching counting, number sequencing, and basic math skills to kids. Number charts offer a visual way to understand number patterns and relationships. We learned patterns in number charts along with different types of number charts. To reinforce our understanding, let’s engage in solving examples and practicing MCQs.
Solved Examples on Number Charts
1. Find the pattern for the number chart given below.
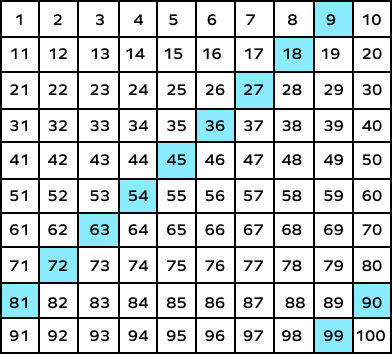
Solution:
The numbers marked in the number chart are:
9, 18, 27, 36, 45, 54, 63, 72, 81, 90 and 99.
It shows skip counting by 9’s.
2. Draw a number chart representing the skip counting by 4’s pattern.
Solution:
To represent skip counting by 4’s, we highlight the following numbers:
4, 8, 12, 16, 20, 24, 28, 32, 36, 40 and so on.

3. Write the missing numbers and label the given number chart.
| 110 | 120 | 130 | ||
| 160 | 170 | 180 | ||
| 220 | 240 | |||
| 300 |
Solution:
The ones digit of all the numbers are 0.
Also, the difference between any two consecutive numbers is 10.
Thus, the chart shows the skip counting by 10’s pattern.
After filling missing numbers, we get:
| 10 | 20 | 30 | 40 | 50 |
| 60 | 70 | 80 | 90 | 100 |
| 110 | 120 | 130 | 140 | 150 |
| 160 | 170 | 180 | 190 | 200 |
| 210 | 220 | 230 | 240 | 250 |
| 260 | 270 | 280 | 290 | 300 |
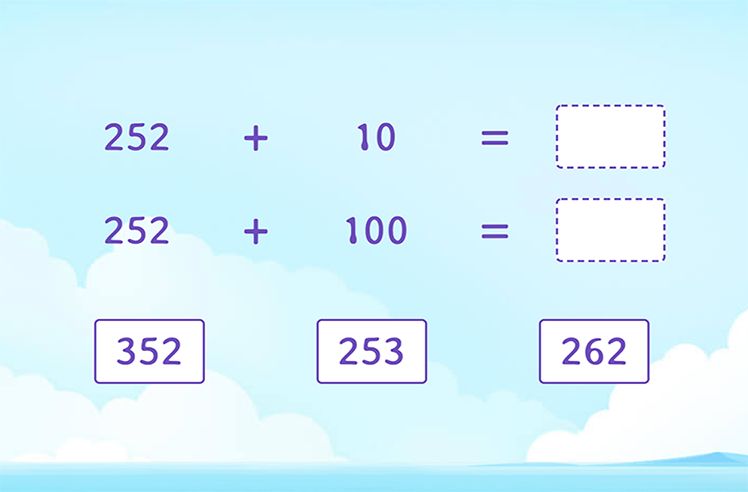
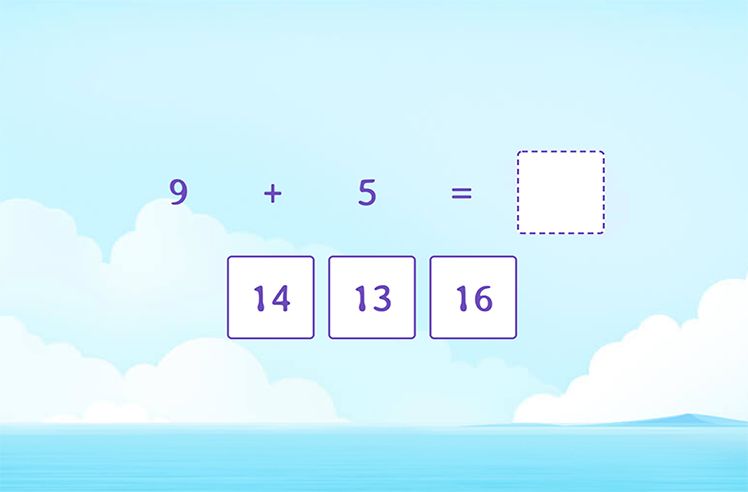
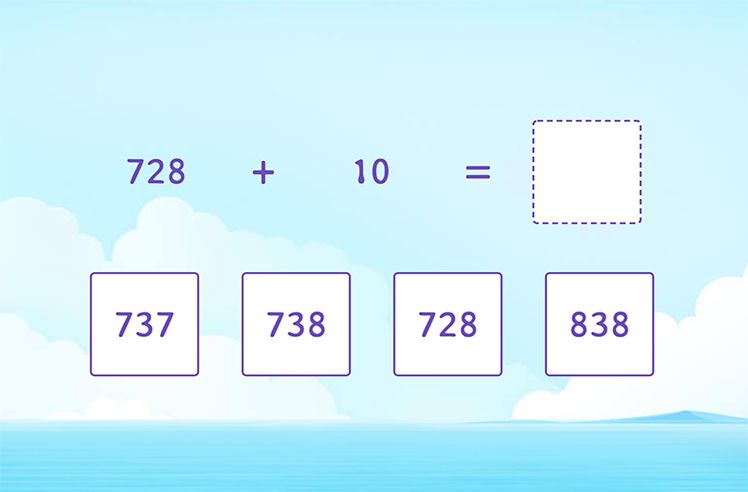
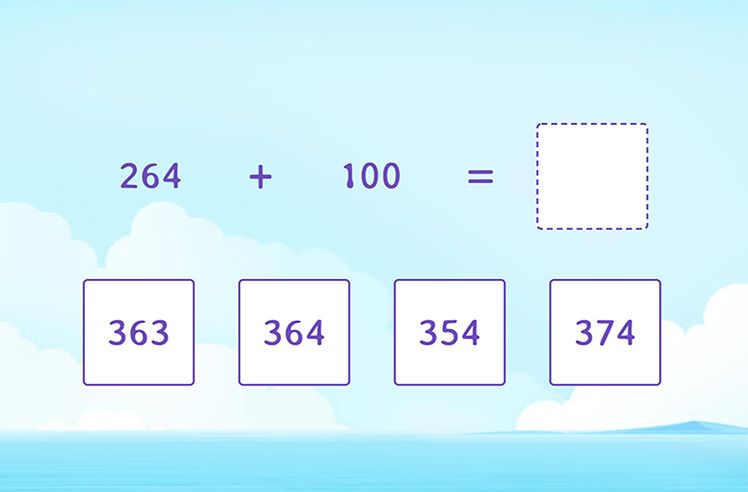
Practice Problems on Number Charts
What is a Number Chart? Definition, Types, Chart, Examples, FAQs
What is a number chart?
A number chart as a list of numbers that are written in a particular numerical order.
Which of the following numbers lie between 40 and 60?
53 lies between 40 and 60 in the number chart
What is the first composite number in the Composite numbers chart?
0 and 1 are neither prime nor composite.
2 and 3 are prime numbers.
The first composite number is 4.
With the help of the number chart, write the predecessor of the number 43.
The number just before the number 43 is 42.
What pattern does the following number chart of even numbers show?
Even numbers are numbers divisible by 2. Even numbers chart shows the skip counting by 2’s pattern.
Frequently Asked Questions about Number Charts
What is the difference between a number chart and place value chart?
A number chart is a chart that shows the list of numbers in an organized way. For example, whole numbers are listed as 0, 1, 2, 3, 4, and so on. On the other hand, the place value chart is used to find the value of each digit of the number.
What skills can children develop using number charts?
Number charts help children develop skills such as number recognition, sequencing, pattern identification, and basic arithmetic operations.
What is a hundreds chart?
A hundreds chart is a number chart 1-100. It is a number grid containing numbers from 1 to 100, arranged in numerical order.